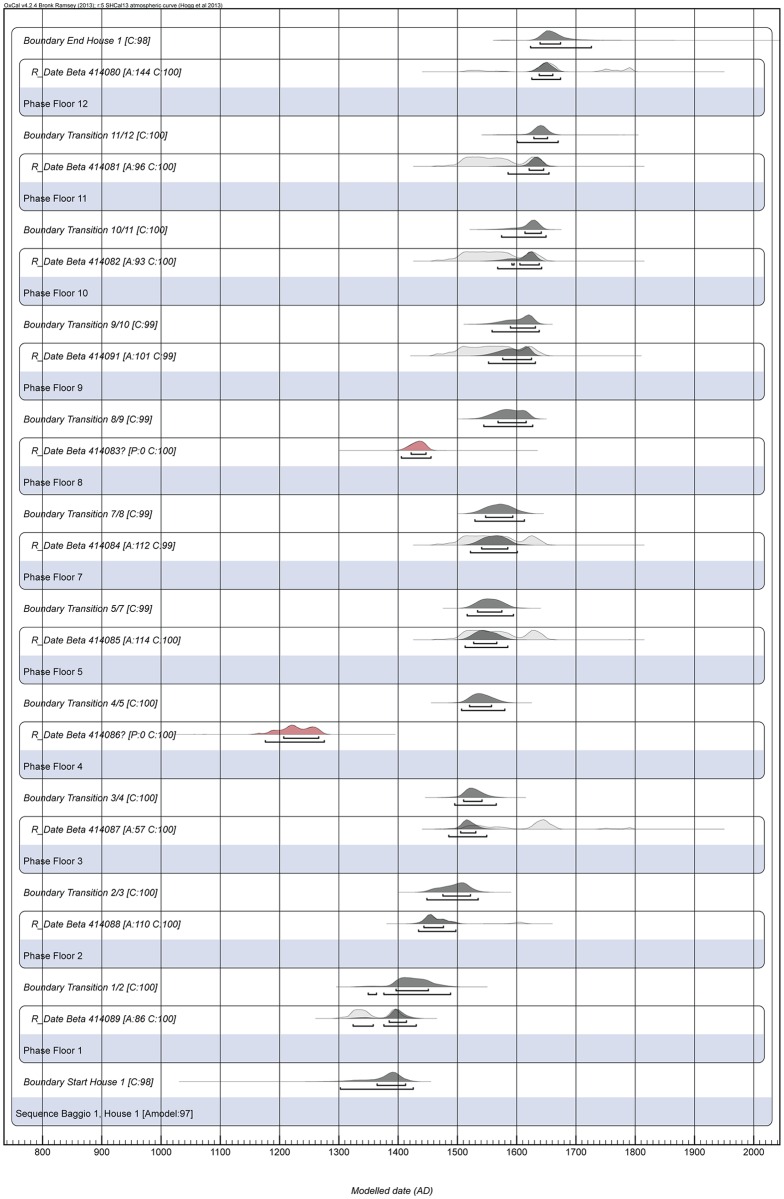
Fig 6. Bayesian model of the dates from House 1.
The unmodelled probability distributions are shown as light grey areas, and the results of the Bayesian model appear as dark grey areas. Bars under each distribution represent 1σ and 2σ. Outliers, shown in red, have been calibrated but not included in the model. C = convergence, A = agreement index of each date, Amodel = overall agreement index of the model.

