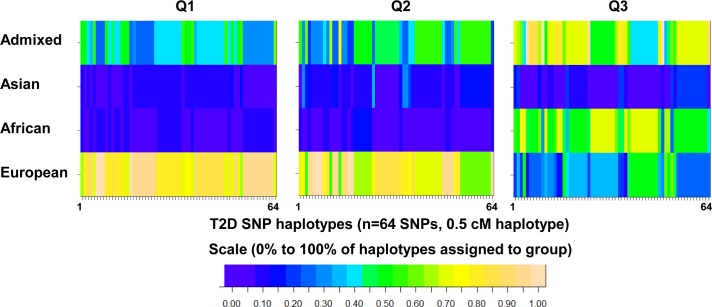
Fig 1. Comparison of Qatari haplotypes in the regions flanking known single nucleotide polymorphisms (SNPs) associated with type 2 diabetes (T2D) or nearby tag SNPs to the relevant haplotypes of European, Asian, African, or Admixed 1000 Genomes populations.
Admixture deconvolution was used to determine if Qatari haplotypes flanking 64 ‘T2D SNPs’ matched the populations where these SNPs were discovered. Haplotypes were inferred for 100 deeply sequenced Qatari genomes (n = 60 Bedouin Q1, n = 20 Persian Q2, n = 20 African Q3), and divided into 2000 SNP (0.5 cM) intervals. For each interval, SupportMix [12] was used to infer the population with the most similar haplotype, using 1000 Genomes Project Phase 1 as a reference (Admixed = ASW, PUR, CLM, MXL; Asian = CHB, CHS, JPT; African = LWK, YRI; European = TSI, IBS, CEU, FIN, GBR). For each interval containing a T2D risk SNP (n = 64, S1 Table), the percentage of Qatari haplotypes assigned to European, Asian, African, or Admixed was determined. Shown is a heatmap of the results, where each column represents a SNP, and each row represents a 1000 Genomes group. Scaled from blue (0%) to tan (100%), colors represent the % of haplotypes for the SNP that are most similar to each Qatari population (Q1, Q2, or Q3).

