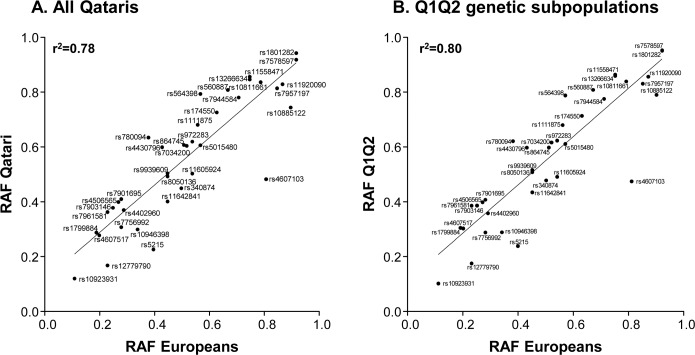
Fig 2. Population risk allele frequencies.
Population risk allele frequencies (RAF) in A. all Qataris, and B. Q1 and Q2 genetic subpopulations combined, compared to European RAF (obtained from Hapmap [23]) for 37 SNPs previously associated with T2D, with the straight line indicating the regression line of best fit of the data.

