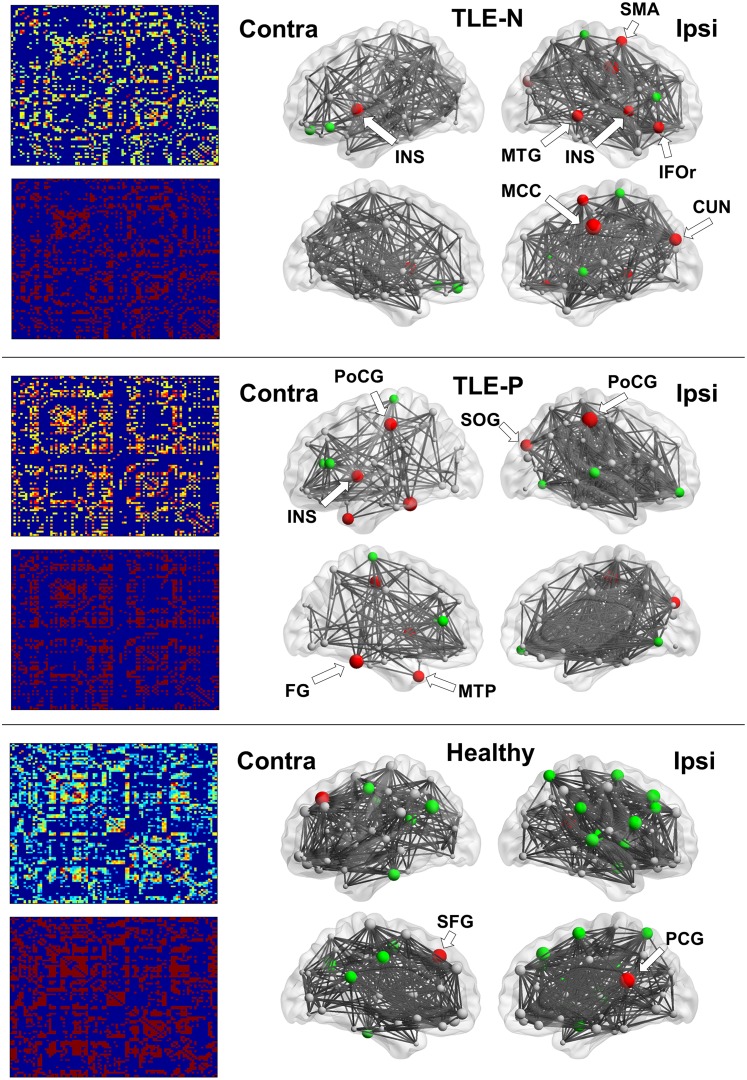
Fig 2. The results of association matrices (left) and network hub nodes and edges (right).
The size of nodes indicates the betweenness centrality (BC). Red denotes hub nodes with BC >2SD, and Green denotes those >1SD. CUN, cuneus; FG, fusiform gyrus; IFOr, inferior orbitofrontal cortex; INS, insula; MCC, middle cingulate gyrus; MTG, middle temporal gyrus; MTP, middle temporal pole; PCG, posterior cingulate gyrus; PoCG, postcentral gyrus; SFG, superior frontal gyrus; SMA, supplementary motor area; SOG, superior occipital gyrus. The locations of nodes >1SD are shown in Table 2.

