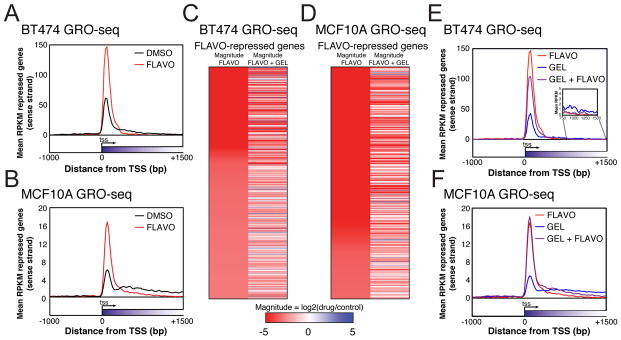
Figure 4. Elongation block caused by P-TEFb inhibition is not dependent on HSP90.
(A) FLAVO-repressed (log-likelihood ratio P < 10−20 for gene body RPKM changes, 9706 genes) metagenes from BT474. Data is from one GRO-seq experiment.
(B) Same as (A) for MCF10A, 12659 genes.
(C) Heatmaps of the expression changes in the top 1000 FLAVO repressed genes with the greatest magnitude of change in BT474 as determined by GRO-seq (log-likelihood ratio P < 10−20) and those same genes when GEL is also added. Colors indicate magnitude expression change in log scale. Red represents repression, blue activation.
(D) Same as (C) for MCF10A.
(E) Metagenes of all FLAVO-repressed genes when GEL is also added to BT474.
(F) Same as (E) for MCF10A.
See also Figure S3 for FLAVO repression of ERBB2 and MYC, and GRO-seq statistics.

