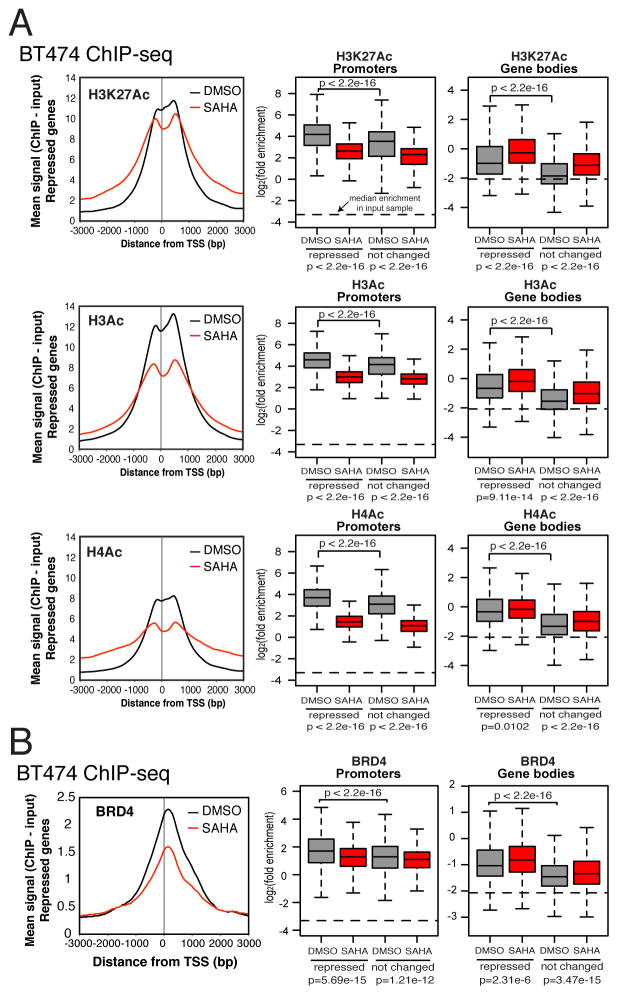
Figure 5. HDACIs affect acetylation of histones and BRD4 binding.
(A) ChIP-seq profiles of acetylated histone tails around TSSs of repressed genes, and their enrichment in promoters and gene bodies. Average acetyl-ChIP-seq profiles from two biological replicates are averaged and normalized to average yield of both replicates. H3Ac antibody recognizes acetylated K9 and K14 in the H3 subunit. H4Ac antibody recognizes acetylated K5, K8, K12, and K16 in the H4 subunit.
(B) BRD4 binding at TSSs and in gene bodies of repressed genes. Quantitation of their binding in repressed and not changed genes is shown in box plots. Statistics reported are from Wilcoxon rank-sum tests. Horizontal lines on boxplot graphs represent median signal in all genes from chromatin input sample. Average of two replicates.

