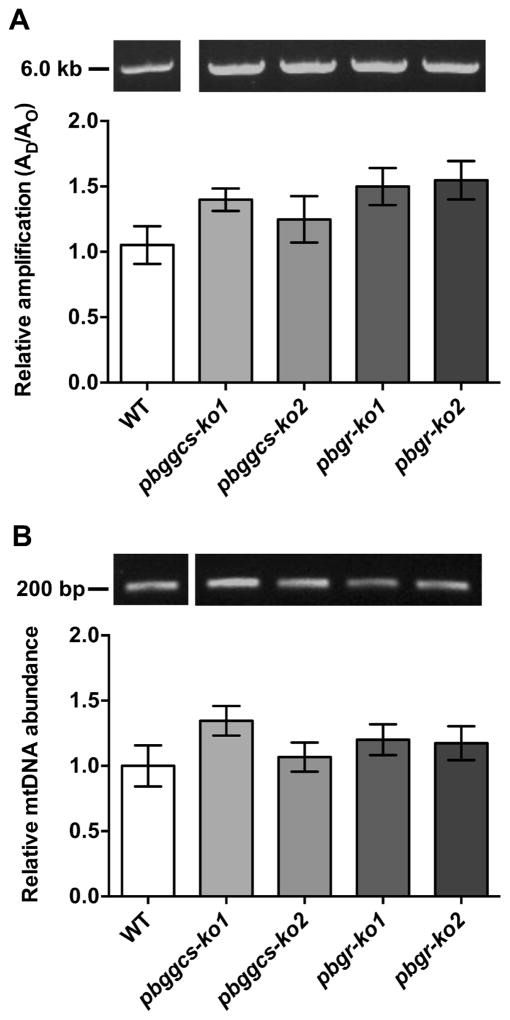
Figure 4. Mutant parasites show no changes in the levels of mtDNA damage or mtDNA abundance.
(A) Upper panel, representative gel showing the amplification of a 5.7 kb mtDNA fragment from WT, pbggcs-ko and pbgr-ko parasites. Lower panel, relative amplification of a 5.7 kb mtDNA fragment that was normalized for changes in mtDNA abundance. (B) Upper panel, representative gel showing the amplification of the 186 bp mtDNA fragment. Lower panel, relative amplification of a 186 bp mtDNA fragment representative of mitochondrial abundance. No significant differences in mtDNA damage or mtDNA abundance were observed between WT and mutant parasites. Bars represent the SEM from 3 independent experiments, and 14 and 12 QPCR analyses for mtDNA damage or mtDNA abundance, respectively.

