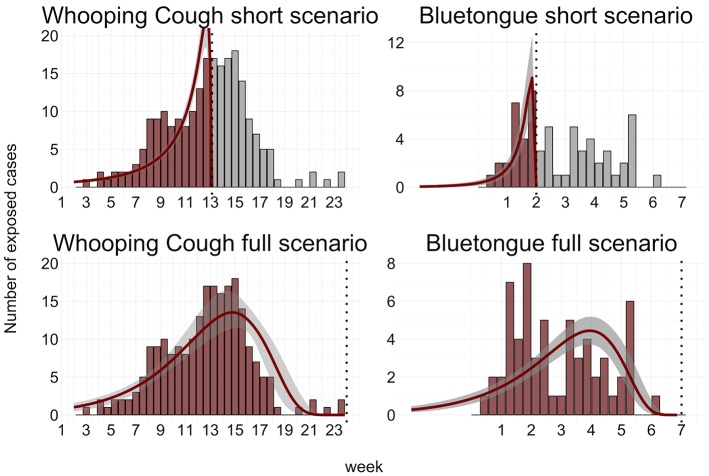
Fig 1. Outbreak scenarios together with estimated epidemic curves.
Top left: Testing 100 whooping cough cases at week 35 of a 2003 Wisconsin outbreak. Top Right: Testing 100 bluetongue cases at week 7 of the 2007 UK outbreak. Bottom left: Testing 25 cases at week 25 of the Wisconsin outbreak. Bottom right: Testing 30 cases at week 3 of the 2007 UK outbreak. In all scenarios, cases were sampled from the full population of cases shown in the outbreak data of Fig 1 that had been exposed before the time of testing. Vertical dashed lines indicate time of cross-sectional sample. Red bars indicate cases included in the sampling frame for testing, grey bars indicate cases not included (note that hindcasting is designed to estimate historic, not future, trends). Red lines indicate the mean posterior hindcast trend based on the cross-sectional test data. The grey transparent regions around the trends indicate the 95% posterior credible interval.

