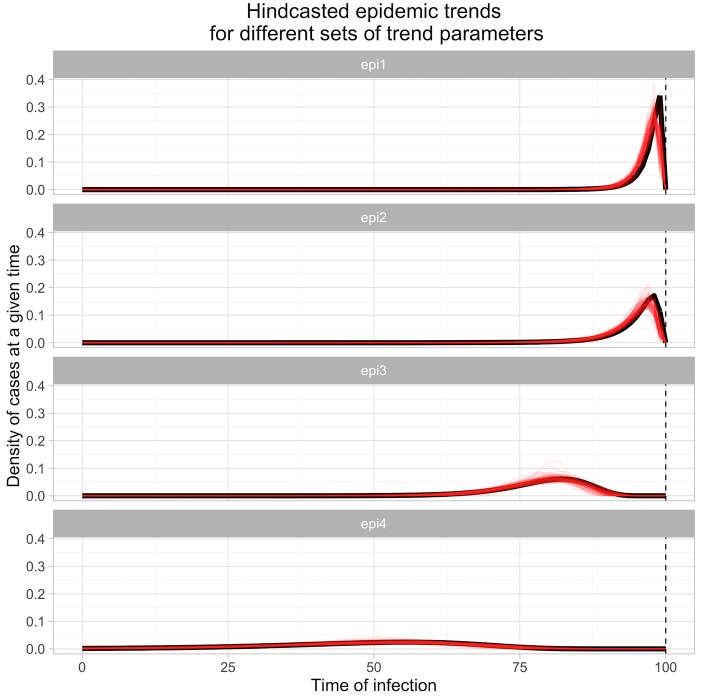
Fig 2. Hindcasted epidemic trends compared to the true lognormal trends.
Each row shows 80 hindcasted posterior mean trends (each estimated trend shown in thin red lines), estimated from between 30 and 100 test results, with exposure times generated using one of four different lognormal epidemic trends (see main text; true trend shown in black), and assuming a lognormal measurement error of 1.3 for the diagnostic tests. Vertical dashed line indicate the time of the cross-sectional sampling.

