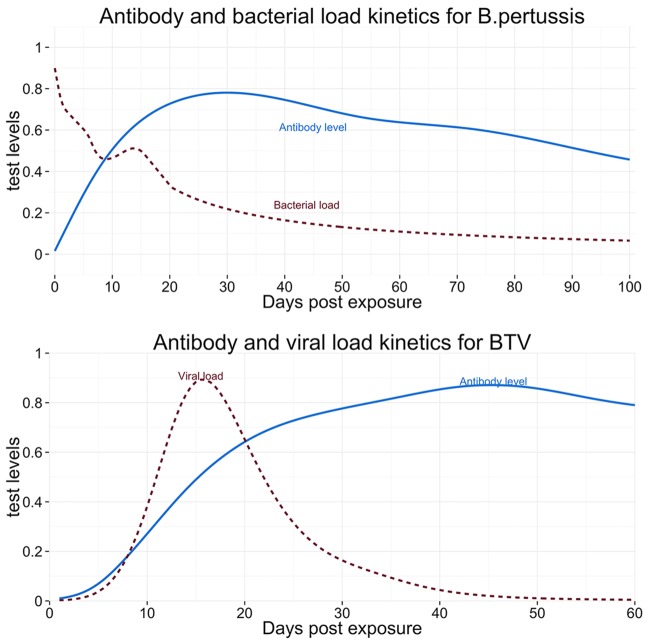
Fig 4. Graphs of the kinetics of diagnostic test kinetics used in the paper.
Top: Diagnostic test kinetics for whooping cough, with an antibody test (solid line) and a test measuring bacterial load (dashed line). Bottom: Diagnostic test kinetics for bluetongue, with an antibody test (solid line), and a test measuring viral load (dashed line). The graph is showing idealised test kinetics, based on published data for whooping cough [34,35] and bluetongue [36] tests(see methods for details).

