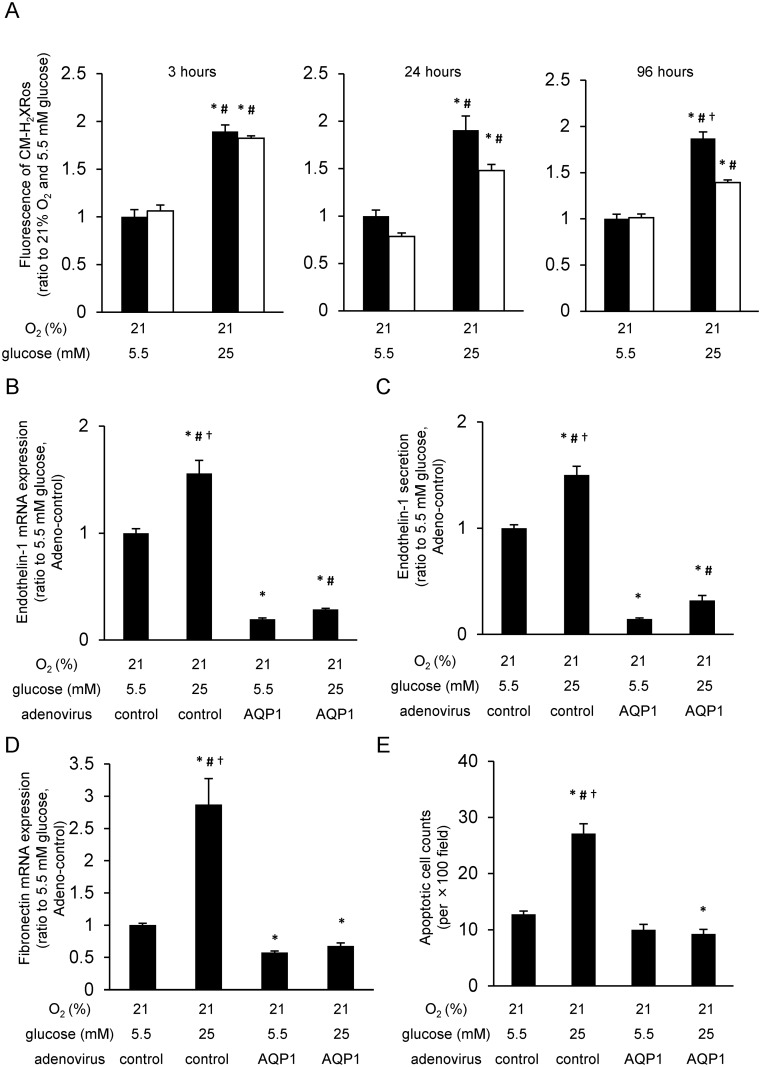
Fig 4. AQP1 overexpression decreased high glucose-induced mitochondrial ROS generation and high glucose-induced phenomena.
(A) Mitochondrial reactive oxygen species (mtROS) generation in aquaporin-1 (AQP1) overexpression cells. Cells were incubated under indicated conditions, and treated with 300 nM CM-H2XRos for 15 min. Relative intensity of fluorescence of CM-H2XRos was measured. Black bars = control adenovirus; white bars = AQP1 adenovirus. *P < 0.05 compared with 5.5 mM glucose and control adenovirus; #P < 0.05 compared with 5.5 mM glucose and AQP1 adenovirus; †P < 0.05 compared with 25 mM glucose and AQP1 adenovirus. Data are eight independent experiments in duplicate ± SEM. (B) Effect of AQP1 overexpression on endothelin-1 mRNA expression. Cells were incubated under indicated conditions for 24 h. The expression levels of endothelin-1 mRNA were measured by quantitative RT-PCR analysis. *P < 0.05 compared with 21% O2, 5.5 mM glucose, and control adenovirus; #P < 0.05 compared with 21% O2, 5.5 mM glucose, and AQP1 adenovirus; †P < 0.05 compared with 21% O2, 25 mM glucose, and AQP1 adenovirus. Data are five independent experiments in duplicate ± SEM. (C) Effect of AQP1 overexpression on endothelin-1 secretion. Cells were incubated under indicated conditions for 24 h, and endothelin-1 secretion was measured by ELISA assay. *P < 0.05 compared with 21% O2, 5.5 mM glucose, and control adenovirus; #P < 0.05 compared with 21% O2, 5.5 mM glucose, and AQP1 adenovirus; †P < 0.05 compared with 21% O2, 25 mM glucose, and AQP1 adenovirus. Data are six independent experiments in duplicate ± SEM. (D) Effect of AQP1 overexpression on fibronectin mRNA expression. Cells were incubated under indicated conditions for 24 h. The expression levels of fibronectin mRNA were measured by quantitative RT-PCR analysis. *P < 0.05 compared with 21% O2, 5.5 mM glucose, and control adenovirus; #P < 0.05 compared with 21% O2, 5.5 mM glucose, and AQP1 adenovirus; †P < 0.05 compared with 21% O2, 25 mM glucose, and AQP1 adenovirus. Data are five independent experiments in duplicate ± SEM. (E) Effect of AQP1 overexpression on cell apoptosis. Cells were incubated under indicated conditions for 168 hours. Data are expressed as the mean number of positive cells/section of 10 independent sections ± SEM. *P < 0.05 compared with 21% O2, 5.5 mM glucose, and control adenovirus; #P < 0.05 compared with 21% O2, 5.5 mM glucose, and AQP1 adenovirus; †P < 0.05 compared with 21% O2, 25 mM glucose, and AQP1 adenovirus.

