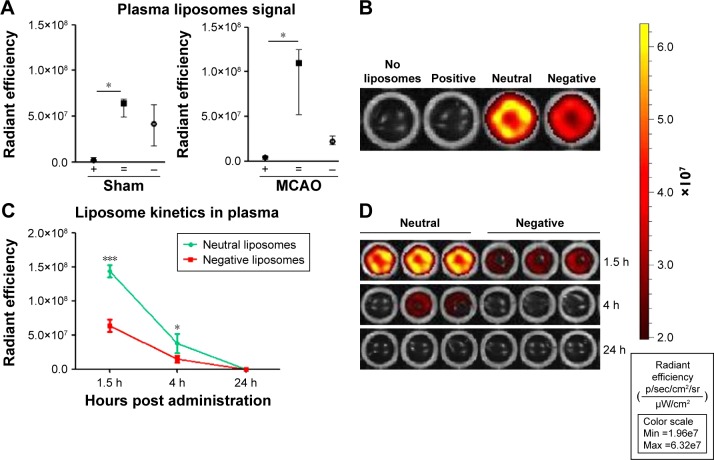
Figure 5.
Presence of liposomes in plasma.
Notes: (A) Plasma collected from sham or ischemic rats 90 minutes after receiving liposomes. Median values (interquartile range) are represented and significant differences are indicated as *P<0.05. (B) Representative plasma image of one experiment. (C) Liposome kinetics in plasma. Blood was collected from naïve rats (with no surgical procedure) after 1.5 hours, 4 hours, and 24 hours of receiving neutral or negatively charged liposomes. Symbols indicated mean ± SD. (D) Image representing data on graph (C). Images are adjusted to the scale positioned beside. In all experiments, three to four animals per group were considered. Significant differences are represented as *P<0.05, and ***P<0.001.
Abbreviations: +, positive; =, neutral; −, negative; MCAO, middle cerebral arterial occlusion; h, hours; p, photons; sec, seconds; sr, steradian; SD, standard deviation.

