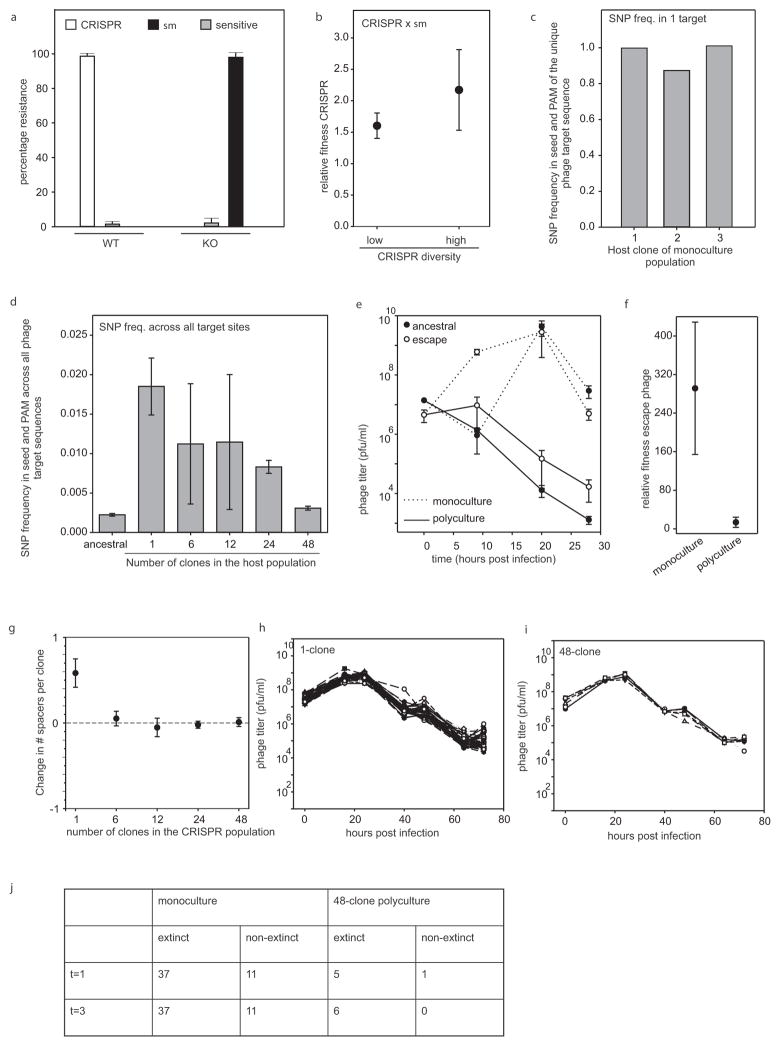
Extended Data Figure 1. CRISPR diversity drives virus extinct since virus cannot escape by point mutation.
a, Percentage bacteria (WT or CRISPR KO) from the experiment shown in Fig. 1 that have evolved CRISPR immunity (white bar), surface immunity (black bar) or remained sensitive (sensitive; grey bars) at 5 d.p.i. with virus DMS3vir (n = 6 for both treatments). b, Relative fitness of CRISPR immune monocultures (single spacer; low diversity, n = 48) and polycultures (48 spacers; high diversity, n = 6) at 3 d.p.i. when competing with a surface mutant (sm) in the absence of virus. c, d, Deep sequencing analysis of the frequency of mutations in the seed region and PAM of the target sequence of virus isolated at t = 1 d.p.i. from the experiment shown in Fig. 4. c, Frequency of point mutation in the target sequence of viral populations isolated from monoculture 1–3 × surface mutant competitions. d, Average frequency of point mutation across all target sites in the ancestral virus genome and in the genomes of virus from pooled samples of all biological replicates from a single diversity treatment (monocultures: n =48; 6-clone: n =8; 12-clone: n =8; 24-clone: n =6; 48-clone: n =6). e, f, Virus that escapes a single spacer present in a diverse CRISPR population decreases in frequency, despite a fitness benefit over ancestral virus. e, Titres (in plaque-forming units per millilitre) over time upon infection of monocultures (dotted line) or polycultures of 48 clones (solid line) with approximately 108 p.f.u. ancestral (closed circles) or escape (open circles) virus. Escape virus was isolated from monocultures 1–6 × surface mutant competitions shown in Figs 2–4, at 24 h.p.i. n =6 for all experiments. The limit of detection is 200 p.f.u. ml−1. f, Relative fitness of escape virus at t = 1 d.p.i. when competing with ancestral virus on CRISPR-resistant monocultures or polycultures consisting of 48 clones. n = 6 for both experiments. g, For each diversity treatment shown in Figs 2–4 we examined the spacer content of 192 randomly isolated clones at both t =0 and t = 3 d.p.i. (384 clones in total per diversity treatment). The change in the total number of spacers between t =0 and t =3 d.p.i was calculated independently for each replicate experiment (number of biological replicates as indicated in legend of Fig. 2) and divided by the number of clones that were examined. The graph indicates the average across the replicates of the change in spacer content per clone. h, i, Titres (in plaque-forming units per millilitre) over time of virus carrying an anti-CRISPR gene (DMS3vir+acrF1) following infection of a bacterial population consisting of an equal mixture of a surface mutant and a monoculture with CRISPR-mediated immunity (h; n =48) or a 48-clone polyculture with CRISPR-mediated immunity (i; n =6). Each clone is equally represented in each treatment. Each line indicates a biological replicate experiment. The limit of detection is 200 p.f.u. ml−1. j, The number of replicate experiments in which the CRISPR immune population went extinct (no detectable white colonies) at 1 and 3 d.p.i. In all cases, n is the number of biological replicates and error bars represent 95% CI.

