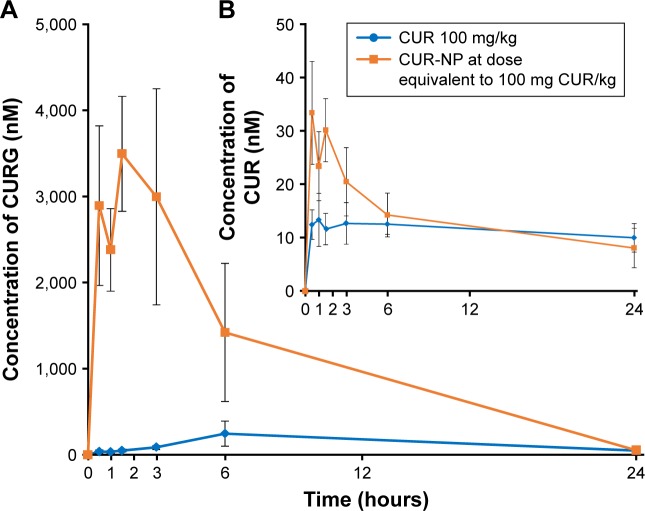
Figure 4.
Concentration–time curves for CURG and CUR.
Notes: Concentration–time curves for (A) CURG and (B) CUR in rat plasma following oral administration of CUR (100 mg/kg) or CUR-NP (at a dose equivalent to 100 mg CUR/kg) (mean ± SE, n=4).
Abbreviations: CUR, curcumin; CURG, curcumin glucuronide; CUR-NP, curcumin nanoparticles; SE, standard error.

