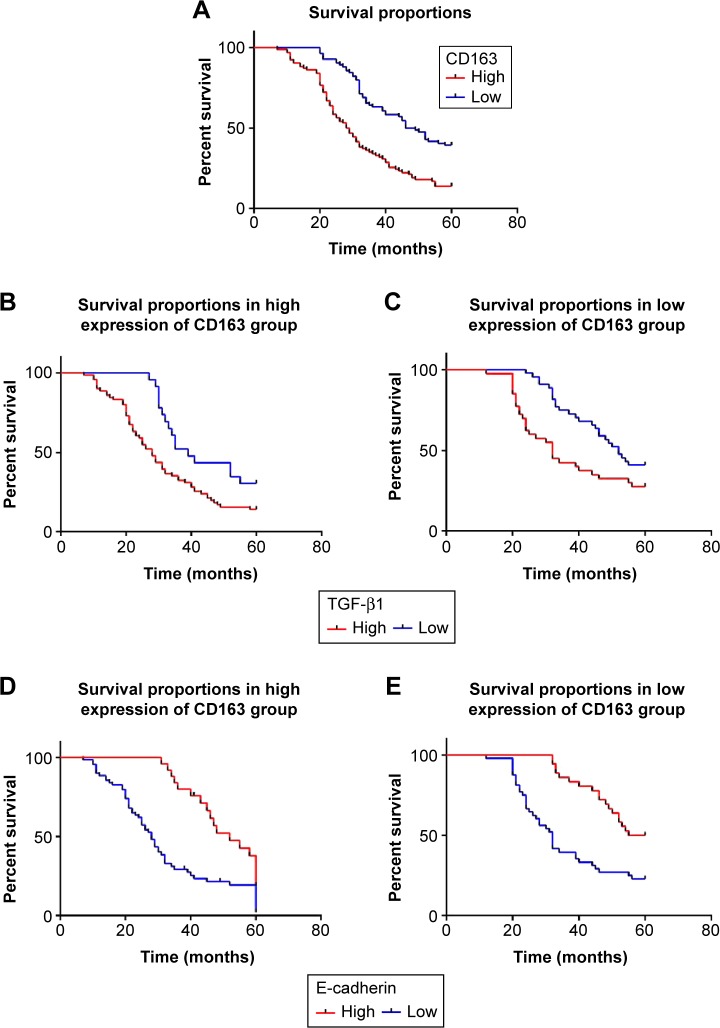
Figure 2.
Kaplan–Meier curves for differential expression of E-cadherin, TGF-β1, and CD163 in gastric cancer.
Notes: Differential expression of three indicators showed a significant difference in cumulative overall survival. (A) Patients with high expression of CD163 showed a poor overall survival (P<0.001). (B, C) Patients with high expression of TGF-β1 had a poor overall survival in high/low expression of CD163 group (P<0.001). (D, E) Patients with low expression of E-cadherin had a poor overall survival in high/low expression of CD163 group (P<0.001).
Abbreviation: TGF-β1, transforming growth factor-β1.

