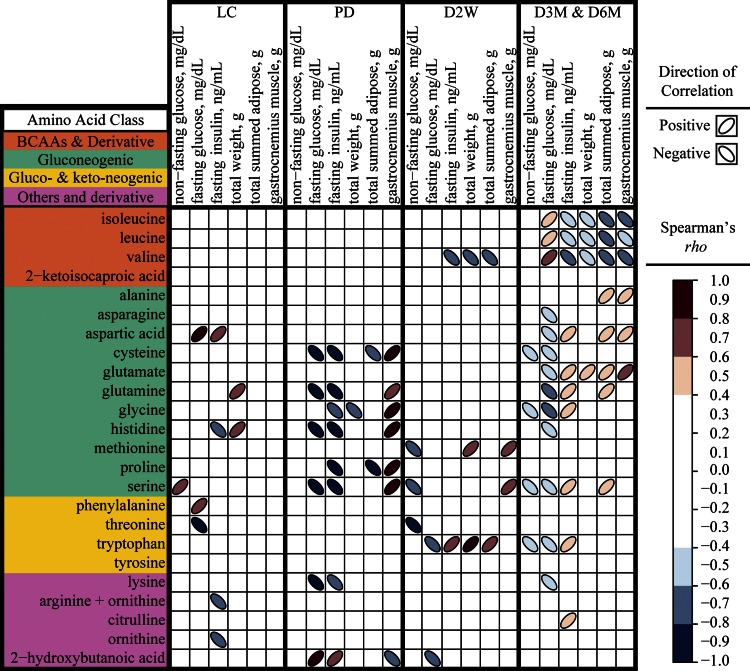
Fig. 4.
Spearman's correlations among clinical parameters and plasma amino acids stratified by diabetes status in rats. Correlations are indicated for lean Sprague-Dawley controls (n = 7), UCD-T2DM rats prior to the onset of diabetes (PD; n = 8), UCD-T2DM rats 2 wk post-onset of diabetes (D2W; n = 9), and UCD-T2DM rats in the later stages of diabetes [3 (D3M) and 6 mo (D6M) post-onset of diabetes; n = 24]. Significant correlations are presented as colored ellipses (P ≤ 0.05). Red ellipses positioned in a positive orientation are positive Spearman's rho correlation coefficients, and blue ellipses positioned in a negative orientation are negative Spearman's rho correlation coefficients. Darker ellipses represent a greater absolute rho correlation coefficient. BCAAs, branched-chain amino acids.

