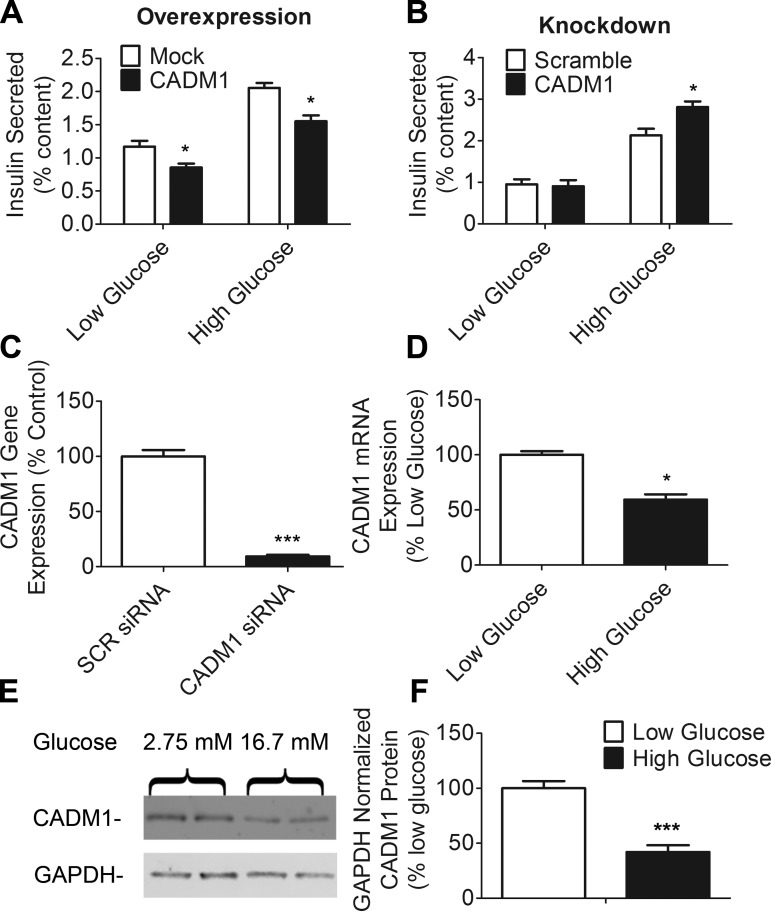
Fig. 2.
Effect of CADM1 expression level on insulin secretion; glucose-sensitive expression of CADM1. A: INS-1 cells were transfected with a CADM1 expression plasmid (black bars) or mock-transfected with empty vector (open bars) and incubated for 48 h, followed by 1 h of incubation in either 2.75 (low) or 16.7 mM (high) glucose with 0.1 mM IBMX. Insulin secretion is shown normalized to total cellular insulin content. B: INS-1 cells were transfected for 72 h with pools of either nontargeting, scrambled (open bars), or CADM1 (black bars) siRNAs and then insulin secretion analyzed as in A. C: RNA was isolated from siRNA-treated INS-1 cells and degree of CADM1 knockdown determined by qPCR. Data are shown normalized to control values obtained using scrambled (SCR) siRNA. D: INS-1 cells were incubated for 18 h in 2.75 (low) or 16.7 mM (high) glucose. RNA was isolated from cells and CADM1 transcript levels measured by qPCR. Data are shown as expression level normalized to that in low-glucose samples (2.75 mM). E: INS-1 cells were incubated in 2.75 or 16.7 mM glucose as in D, and then CADM1 protein levels were analyzed by immunoblot analysis of cell lysates. GAPDH protein was probed as a loading control. F: bands from E were quantitated. GAPDH-normalized CADM1 levels were normalized to control levels. All data are represented as means ± SE from 6 samples and representative of 3 experiments; qPCR and insulin RIA samples were assayed in duplicate. *P < 0.05; ***P < 0.005.

