Fig. 4.
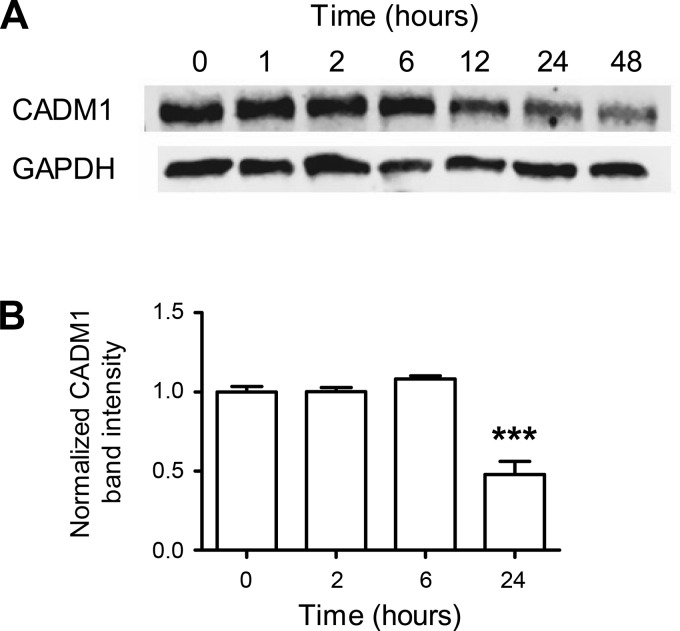
Kinetics of glucose-induced downregulation of CADM1 protein. INS-1 cells were incubated overnight in 5 mM glucose, followed by exposure (at time t = 0) to 16.7 mM glucose. A: cell lysates at various time points were collected and equal amounts of protein immunoblotted for CADM1 and a loading control, GAPDH. The immunoblot shown is representative of 4 independent experiments. B: time points repeated at least 3 times over the course of the separate time course experiments were quantitated by infrared fluorescent imaging of the immunoblots using a LiCor Odyssey imaging system. Data are shown as CADM1 expression levels normalized to GAPDH and relative to the zero time point (mean normalized CADM1 band intensity at time 0 is 1). Bars are means ± SE of 3 experiments. ***P < 0.005

