Fig. 2.
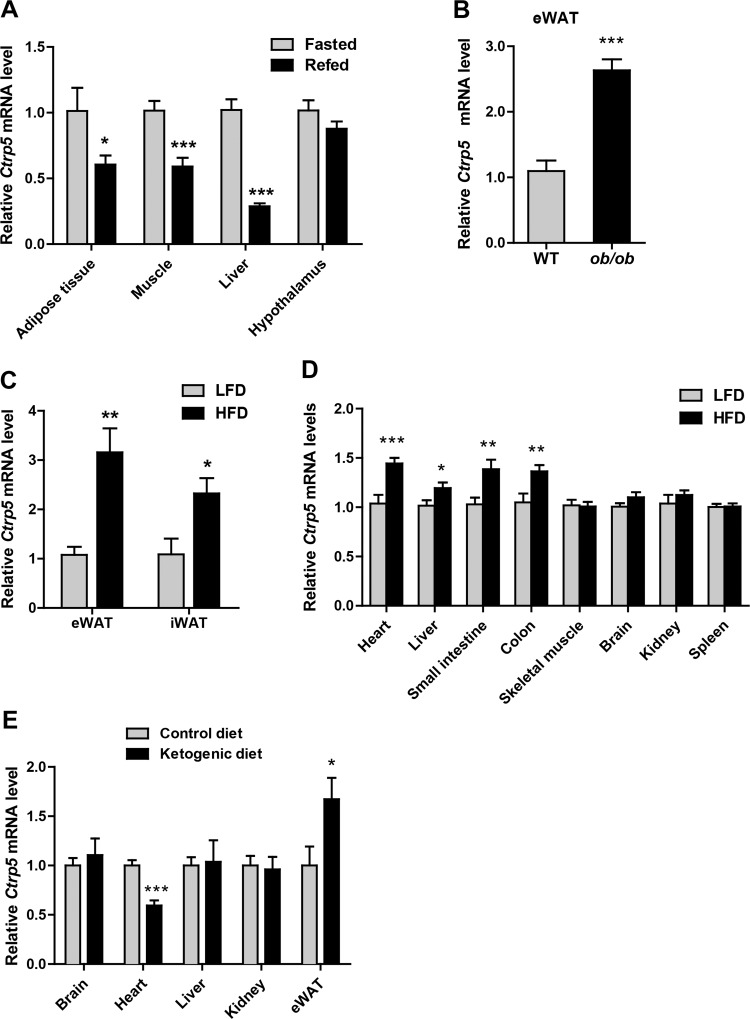
Ctrp5 expression in different metabolic states. A: quantitative real-time PCR analysis of Ctrp5 expression in epididymal white adipose tissue (eWAT), skeletal muscle, liver, and hypothalamus of mice subjected to overnight fast (fasted group; n = 7) or overnight fast followed by 3 h of refeeding (refed group; n = 8). Expression levels were normalized to β-actin. B and C: quantitative real-time PCR analysis of Ctrp5 expression in eWAT from leptin-deficient ob/ob (n = 10) and wild-type (WT) lean controls (n = 9) or in eWAT and inguinal white adipose tissue (iWAT) from mice fed a control low-fat diet (LFD; n = 8) vs. a high-fat diet (HFD; n = 8). D: expression levels of Ctrp5 in the brain and peripheral tissues of a separate cohort of LFD-fed (n = 11) and HFD-fed (n = 11) mice. Expression levels were normalized to β-actin. E: quantitative real-time PCR analysis of Ctrp5 expression in brain, heart, liver, kidney, and eWAT from mice fed a ketogenic diet (n = 8) or matched control diet (n = 8). Expression levels were normalized to the average of 18s rRNA, Gapdh, β-actin, and Rpl-22. *P < 0.05; **P < 0.01; ***P < 0.001.

