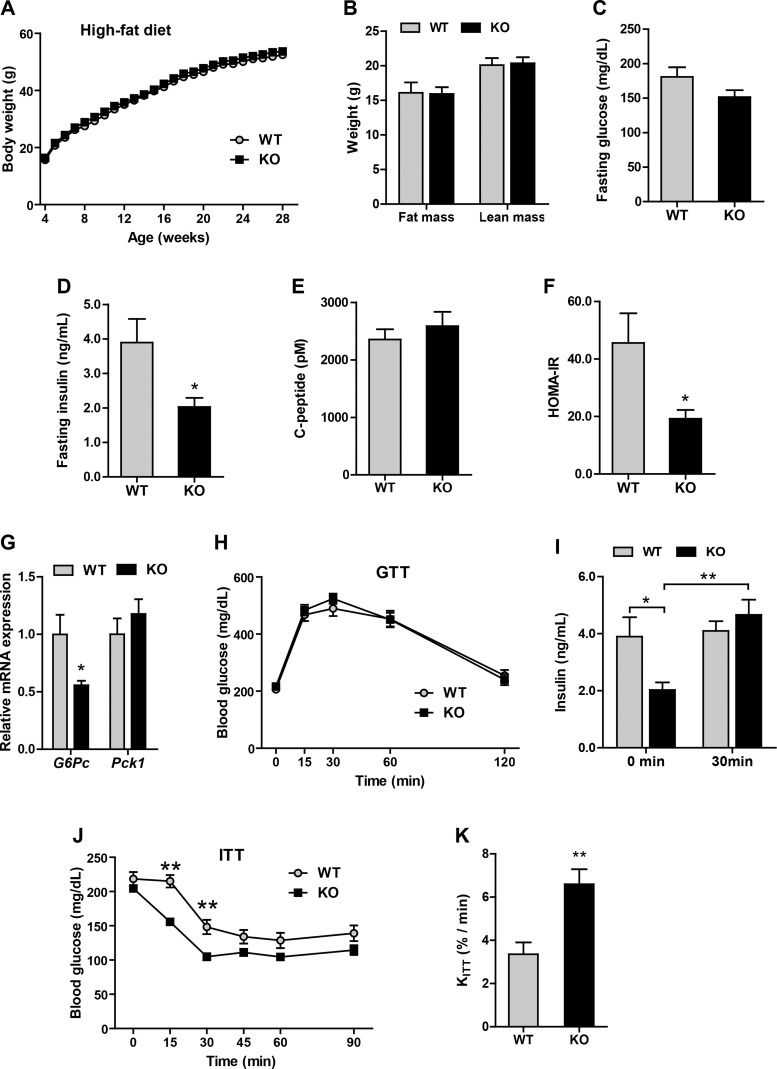
Fig. 6.
Improved insulin sensitivity in Ctrp5-null mice fed a high-fat diet. A: body weight of wild-type (WT) and knockout (KO) male mice over time. B: fat and lean mass in WT and KO mice quantified by Echo-MRI at 21 wk of age. C–F: fasting blood glucose, insulin, and C-peptide levels as well as the calculated insulin resistance (HOMA-IR) index for WT and KO mice at 20 wk of age. G: real-time PCR for gluconeogenic gene (G6Pc and Pck1) expression in liver of WT and KO mice. H: blood glucose levels for WT and KO mice were measured at the indicated time points during glucose tolerance test (GTT). I: WT and KO serum insulin levels at 0 and 30 min after glucose injection. J: WT and KO blood glucose levels were measured at the indicated time point during insulin tolerance test (ITT). K: the decay constant (KITT) for WT and KO mice based on the ITT data. WT, n = 8; KO, n = 7. *P < 0.05; **P < 0.01.

