Fig. 3.
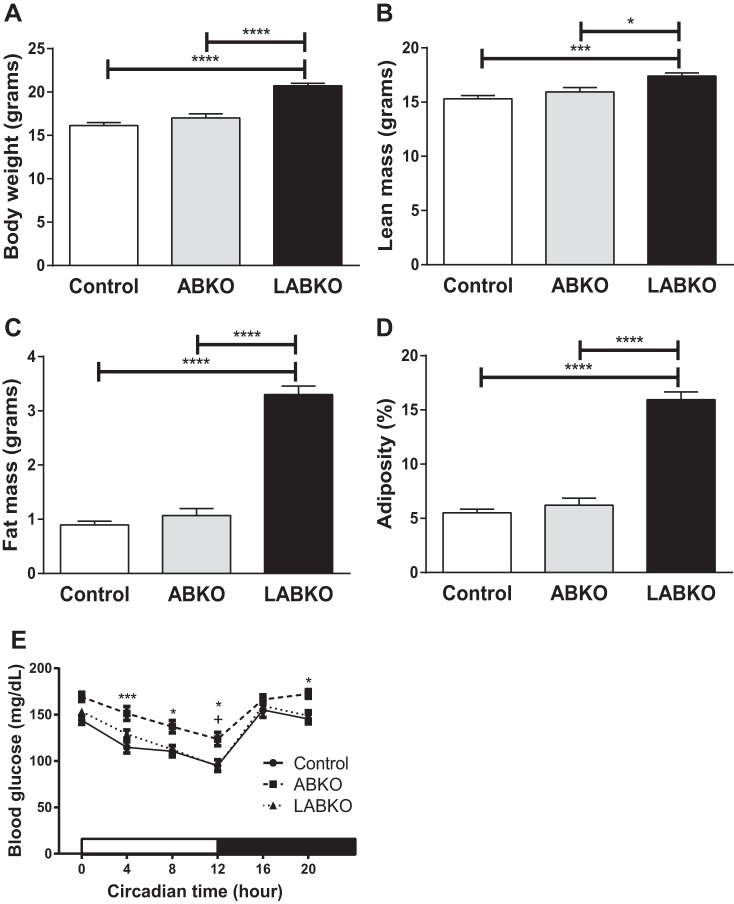
Body weight, body composition, and blood glucose of 13- to 24-wk-old female mice fed a standard rodent chow; n = 7–9/group. A: body weight, F(2, 20) = 37.99, P < 0.0001. B: lean mass, F(2, 20) = 10.63, P = 0.0007. C: fat mass, F(2, 20) = 124.9, P < 0.0001. D: %adiposity, F(2, 20) = 106.3, P < 0.0001. E: blood glucose measured beginning at circadian time 0. Genotype: F(2, 74) = 10.72, P < 0.0001; time: F(5, 370) = 65.51, P < 0.0001; interaction: F(10, 370) = 1.058, P = 0.3938 (n = 17–31/group). Effects of genotype are indicated by horizontal lines terminating in vertical lines. *P < 0.05, comparison between control and ABKO; +P < 0.05, comparison between ABKO and LABKO in E; ***P < 0.001; ****P < 0.0001.

