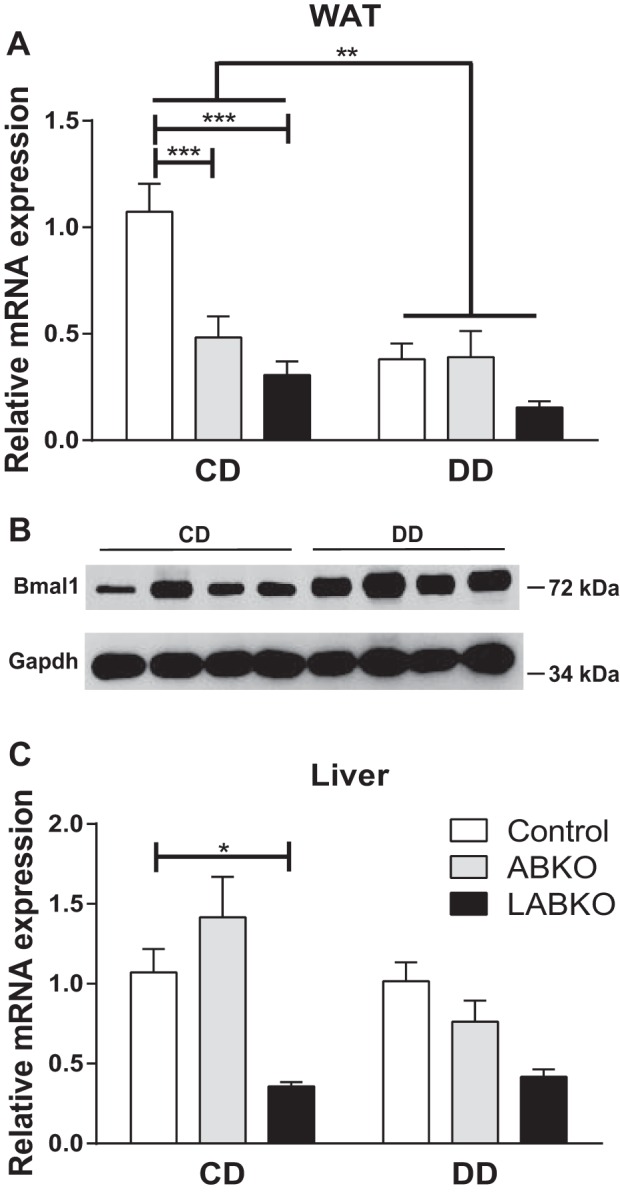
Fig. 4.

Deletion of Bmal1 in WAT and liver of 24-wk-old male mice on control diet (CD) or diabetogenic diet (DD) for 16 wk. A: Bmal1 expression at circadian time 0 in WAT. Genotype: F(2, 39) = 8.433, P = 0.0009; diet: F(1, 39) = 9.94, P = 0.0031; interaction: F(2, 39) = 4.676, P = 0.0151 (n = 4–11/group). B: Western blot analysis of BMAL1 in WAT of control mice on CD or DD. C: Bmal1 expression at circadian time 0 in liver. Genotype: F(2, 37) = 8.64, P = 0.0008; diet: F(1, 37) = 2.305, P = 0.1374; interaction: F(2, 37) = 2.611, P = 0.0869 (n = 5–9/group). Effects of genotype are indicated by horizontal lines terminating in vertical lines. Effects of diet are indicated by brackets terminating in horizontal lines. *P < 0.05; **P < 0.01; ***P < 0.001.
