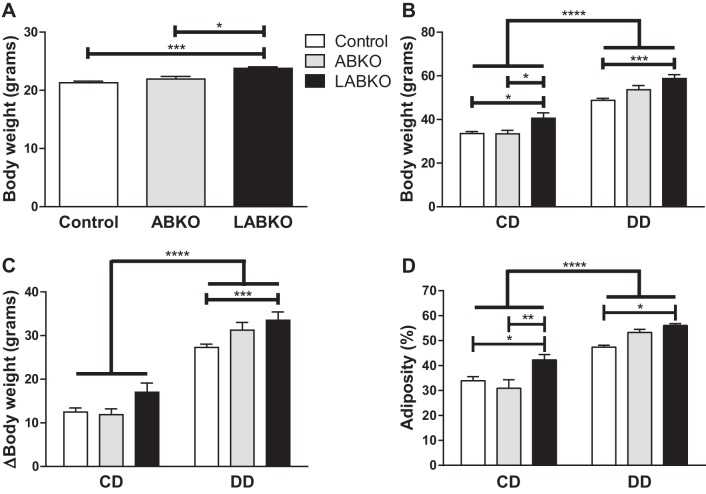
Fig. 5.
Body weight and composition of male mice fed a control diet (CD) or a diabetogenic diet (DD) for 16 wk; n = 5–18/group. A: body weight prior to initiation of diets at week 8; F(2, 59) = 8.981, P = 0.0004. B: body weight at the end of study at week 24. Genotype: F(2, 56) = 15.12, P < 0.0001; diet: F(1, 56) = 204.1, P < 0.0001; interaction: F(2, 56) = 2.003, P = 0.1444. C: change in body weight from week 8 to week 24. Genotype: F(2, 56) = 9.023, P = 0.0004; diet: F(1, 56) = 228.7, P < 0.0001; interaction: F(2, 56) = 2.032, P = 0.1407. D: %adiposity at week 24. Genotype: F(2, 56) = 8.202, P = 0.0008; diet: F(1, 56) = 95.17, P < 0.0001; interaction: F(2, 56) = 3.521, P = 0.0363. Effects of genotype are indicated by horizontal lines terminating in vertical lines. Effects of diet are indicated by brackets terminating in horizontal lines. *P < 0.05; **P < 0.01; ***P < 0.001; ****P < 0.0001.

