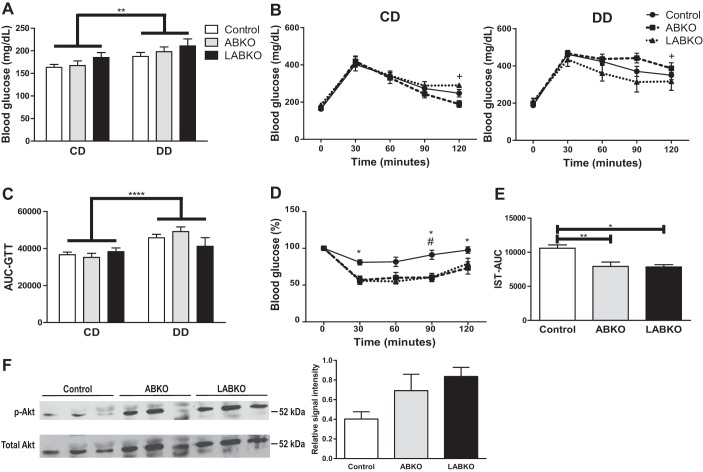
Fig. 7.
Glycemic control in 24-wk-old male mice fed a control diet (CD) or a diabetogenic diet (DD) for 16 wk; n = 5–18/group. A: fasting blood glucose concentrations following a 4-h fast. Genotype: F(2, 56) = 1.956, P = 0.1509; diet: F(1, 56) = 8.497, P = 0.0051; interaction: F(2, 56) = 0.05681, P = 0.9448. B: glucose tolerance following a 4-h fast in mice fed CD, genotype F(2, 28) = 0.8944, P = 0.4202, time F(4, 112) = 75.99, P < 0.0001, interaction F(8, 112) = 1.436, P = 0.1894; and in mice fed DD, genotype F(2, 28) = 1.29, P = 0.291, time F(4, 112) = 80.27, P < 0.0001, interaction F(8, 112) = 1.909, P = 0.0654. C: area under the curve (AUC) calculated from glucose tolerance test. Genotype: F(2, 56) = 0.3693, P = 0.6929; diet: F(1, 56) = 18.25, P < 0.0001; interaction: F(2, 56) = 1.989, P = 0.1464. D: insulin sensitivity following a 1-h fast in mice fed DD. Genotype: F(2, 28) = 7.759, P = 0.0021; time: F(4, 112) = 33.28, P < 0.0001; interaction: F(8, 112) = 3.42, P = 0.0015. E: AUC calculated from insulin sensitivity test. F(2, 28) = 7.768, P = 0.0021. F: Western blot and densitometry analyses of total and phosphorlated Akt (p-Akt) in WAT of mice on DD injected with insulin, F(2, 6) = 3.495, P = 0.0985. Effects of genotype are indicated by horizontal lines terminating in vertical lines. Effects of diet are indicated by brackets terminating in horizontal lines. *P < 0.05, comparison between control and ABKO; #P < 0.05, comparison between control and LABKO; +P < 0.05, comparison between ABKO and LABKO in B and D; **P < 0.01; ****P < 0.0001.

