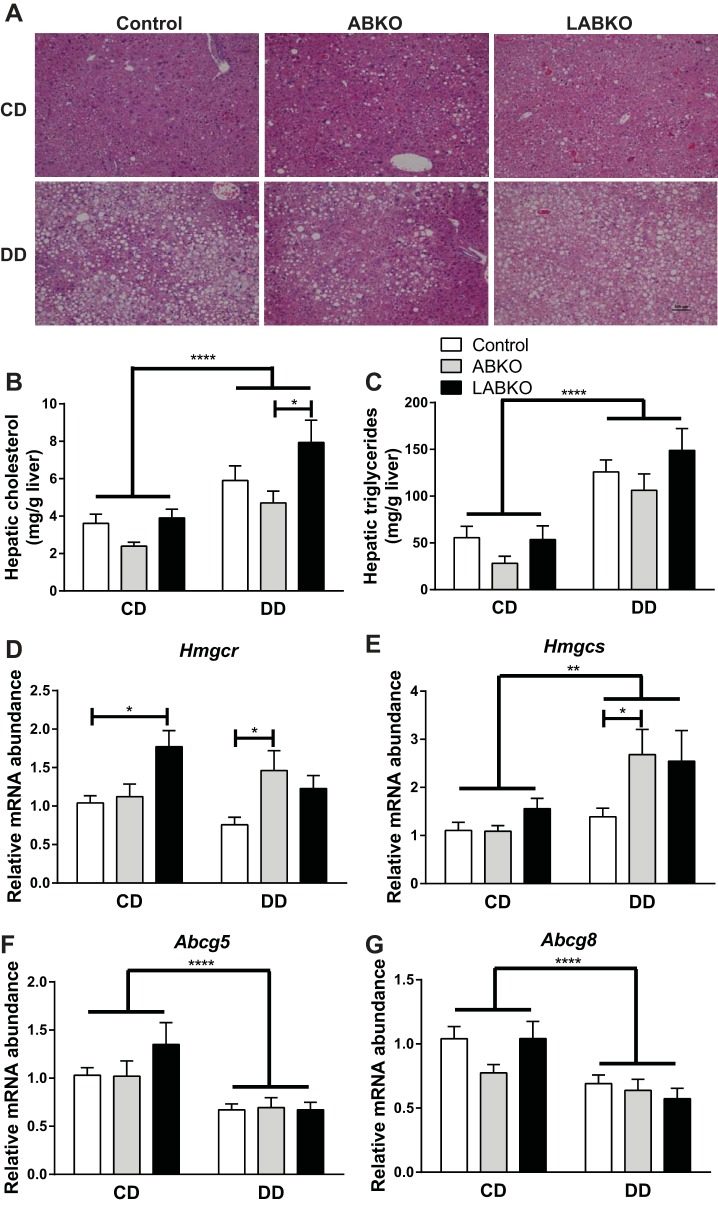
Fig. 8.
Liver histology, hepatic lipids, and gene expression from liver isolated at circadian time 0 in 24-wk-old male mice fed a control diet (CD) or a diabetogenic diet (DD) for 16 wk. A: representative images of H & E stain. B: total cholesterol. Genotype: F(2, 26) = 5.095, P = 0.0136; diet: F(1, 26) = 25.42, P < 0.0001; interaction: F(2, 26) = 0.9054, P = 0.4167. C: triglycerides. Genotype: F(2, 26) = 2.519, P = 0.1000; diet: F(1, 26) = 44.3, P < 0.0001; interaction: F(2, 26) = 0.3547, P = 0.7047 (n = 4–7/group). D: gene expression of Hmgcr. Genotype: F(2, 39) = 6.118, P = 0.0049; diet: F(1, 39) = 1.268, P = 0.267; interaction: F(2, 39) = 3.374, P = 0.0445. E: gene expression of Hmgcs. Genotype: F(2, 39) = 3.582, P = 0.0373; diet F(1, 39) = 12.54, P = 0.001; interaction: F(2, 39) = 2.471, P = 0.0976. F: gene expression of Abcg5. Genotype F(2, 39) = 0.8746, P = 0.4251; diet: F(1, 39) = 19.89, P < 0.0001; interaction: F(2, 39) = 1.024, P = 0.3685. G: gene expression of Abcg8. Genotype: F(2, 39) = 2.004, P = 0.1484; diet: F(1, 39) = 18.92, P < 0.0001; interaction: F(2, 39) = 1.747, P = 0.1876 (n = 5–9/group). Effects of genotype are indicated by horizontal lines terminating in vertical lines. Effects of diet are indicated by brackets terminating in horizontal lines. *P < 0.05; **P < 0.01; ****P < 0.0001.

