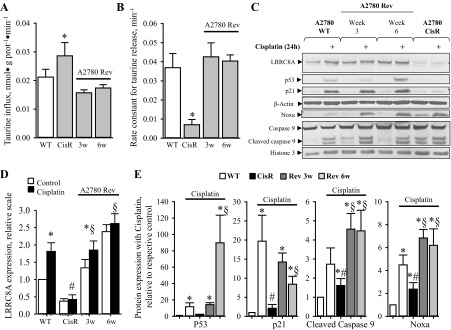
Fig. 7.
The Cisplatin induced phenotype of A2780CisR is reversible. Continued Cisplatin treatment of A2780CisR was stopped by omission of Cisplatin from the growth medium, and cellular characteristics (taurine influx, swelling induced taurine efflux, and response to Cisplatin treatment) in the progressing cell line, designated A2780Rev, were determined 3 and 6 wk (3w/6w) after redraw of Cisplatin. A: cellular taurine influx (nmol·g protein−1·min−1) was determined under isotonic conditions by tracer technique in A2780WT, resistant cells (CisR), and reversing (A2780 Rev) cells. Taurine influx (nmol·g protein−1·min−1) was determined from the slope of time traces. Values for A2780CisR and A2780Rev cells (gray bars) are given relative to A2780WT cells (open bars) and represent means of 3 sets of experiments. *Significantly increased compared with WT cells. B: fractional rate constant (min−1) for taurine release was determined and plotted vs. time (min) under isosmotic and hyposmotic conditions. The maximal rate constant for taurine release was determined 6 min after hyposmotic exposure. Data represent the mean maximal rate constants determined from 3 sets of experiments ± SE. *Significantly reduced compared with control (Student's t-test). C–E: whole cell protein lysates for Western blot analysis were obtained from A2780WT, A2780CisR, and A2780Rev (after 3 and 6 wk) cells exposed to 10 μM Cisplatin for 24 h. Protein expression of LRRC8A, p53, p21, Noxa, Caspase-9, and Bax was determined using specific antibodies (see experimental procedures). β-Actin or Histone 3 were used as loading controls. C: representative Western blot. D: LRRC8A protein expression relative to β-actin in A2780WT, A2780CisR, and A2780Rev (open bars) control cells and following 24 h Cisplatin exposure (black bars). Data represent 3–7 individual sets of experiments, where ratios are given relative to the untreated WT cells ± SE. * and #: Expression is significantly increased in Cisplatin-treated cell compared with control cells and significantly reduced in Cisplatin-treated A2780CisR cells compared with Cisplatin-treated A2780WT cells, respectively (ANOVA, Fisher LSD method); § indicates expression following cisplatin exposure is significantly increased in A2780 Rev compared with CisR (Student's t-test). E: graph represents the relative effect of Cisplatin (Cisplatin-treated/respective untreated control) on p53, p21, cleaved Caspase-9, and Noxa protein expression in A2780WT, A2780CisR, and A2780Rev cells. Data represent mean of 3–7 individual experiments ± SE. * and #: Expression is significantly increased in Cisplatin-treated cell compared with control cells and significantly reduced in Cisplatin-treated A2780CisR cells compared with Cisplatin-treated A2780WT cells, respectively (ANOVA, Fisher LSD method). § indicates expression following cisplatin exposure is significantly increased in A2780 Rev compared with CisR (Student's t-test).

