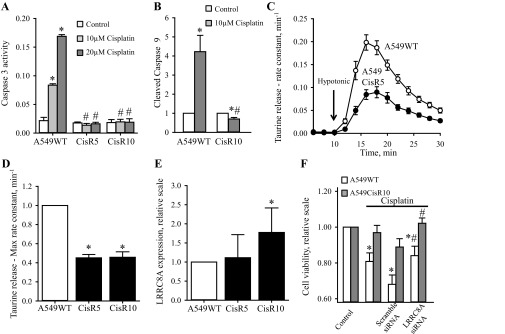
Fig. 8.
Acquired Cisplatin resistance in human lung A549 cells involves reduction in swelling-induced taurine efflux, increased or unaltered expression of LRRC8A, and abolished Caspase-3/-9 activation. The Cisplatin-resistant A549 cells (A549CisR5 and A549CisR10) were developed by exposing A549WT cells to 5 or 10 μM of Cisplatin, respectively, for a period of 6 mo. To maintain the Cisplatin-resistant phenotype, A549CisR5 and A549CisR10 cells were continuously treated with either 5 μM (A549CisR5) or 10 μM (A549CisR10) Cisplatin once a week. A: lysates from A549WT, CisR5, and CisR10 cells exposed to increasing concentrations of Cisplatin (0, 10, and 20 μM, 24 h) were used for selective analysis of Caspase-3 activities. Data represent 3 individual experiments ± SE. * and #: Significantly increased by Cisplatin compared with the respective control and significantly reduced compared with Cisplatin treatment in A549WT cells, respectively (ANOVA, Fisher LSD method). B: cleavage of Caspase-9 was determined by Western blot analysis using a specific human antibody against Caspase-9. The Western blot (see Fig. 10) was quantified and illustrated in a bar graph. The effect of Cisplatin treatment (gray bar, 10 µM, 24 h) was set relative to its respective untreated control (open bar). Data represent mean of 4 individual experiment ± SE. * and #: Expression is significantly increased in Cisplatin-treated cell compared with control cells and significantly reduced in Cisplatin-treated A549CisR10 cells compared with Cisplatin-treated A549WT cells, respectively (ANOVA, Fisher LSD method). C: A549WT (○) and A549CisR5 (●) cells were loaded before the experiments with [3H]taurine, washed, and exposed to isosmotic NaCl medium (320 mOsM) for 10 min and subsequently to hyposmotic medium (200 mOsM) for 20 min (arrow indicates shift in tonicity). Samples were taken every 2 min. The fractional rate constant (min−1) for taurine release was determined and plotted vs. time (min). Data represent the mean of 11 sets of experiments. D: bar graph represents the maximal rate constant for taurine release in A549WT, CisR5 and CisR10 determined 6 min after hyposmotic exposure (see A). Values are given relative to A549WT control and represent the mean of 11 (CisR5) and 5 (CisR10) sets of experiments ± SE. *Significantly reduced compared with A549WT cells (Student's t-test). E: quantification of whole cell LRRC8A protein levels in A549WT, CisR5, and CisR10 cells determined by Western blot analysis using a monoclonal antibody against human LRRC8A. The LRRC8A expression levels were normalized to β-actin and the ratio given relative to A549WT. Data represent 5 (CisR5) and 10 (CisR10) sets of experiments ± SE. *Significantly increased compared with A549WT cells (Student's t-test). F: effect of LRRC8A knock-down on cell viability after Cisplatin treatment was determined by MTT (see experimental procedures). A549WT and CisR10 were transfected with either scramble or LRRC8A siRNA; following 1 day transfection, half of the cells were treated with 10 μM Cisplatin and left for another 48 h before measuring cell viability. Data represent 5 individual sets of experiments ± SE. * and #: Significantly decreased by Cisplatin compared with the respective control and significantly increased compared with Cisplatin treatment in scramble siRNA transfected cells, respectively (ANOVA, Fisher LSD method).

