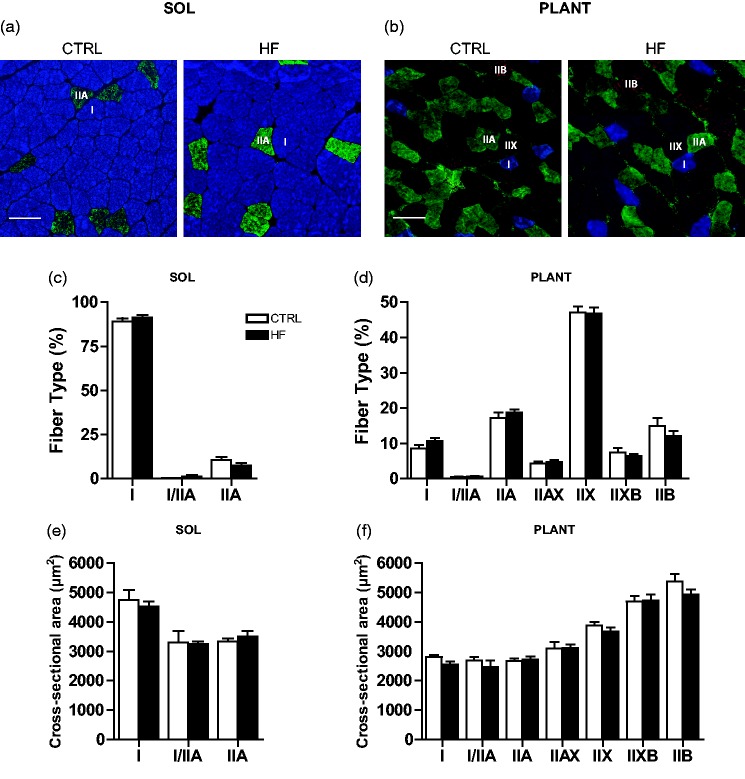
Figure 2.
Skeletal muscle fiber type and cross-sectional area (CSA). Representative images of MHC staining in soleus (a) and plantaris (b) showing type I (I; blue), type IIA (IIA; green), type IIX (IIX; unstained), and type IIB (IIB; red) fibers. Quantification of fiber type distribution (c and d) and fiber cross-sectional area in soleus and plantaris (e and f), respectively. Bars represent 100 µm. (A color version of this figure is available in the online journal.)

