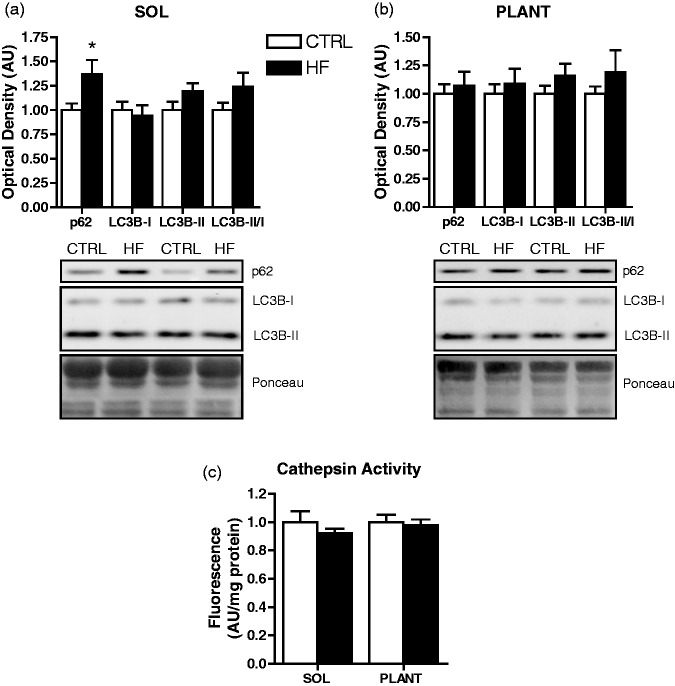
Figure 8.
Autophagosome-associated protein expression and lysosomal enzymatic activity. Quantitative analysis and representative immunoblots of p62, LC3B-I, and LC3B-II (as well as calculated LC3B-II/I ratio) in soleus (a) and plantaris (b). Also shown are corresponding Ponceau-stained membranes. Quantitative analysis of cathepsin enzymatic activity in soleus and plantaris (c). *P < 0.05 vs. CTRL

