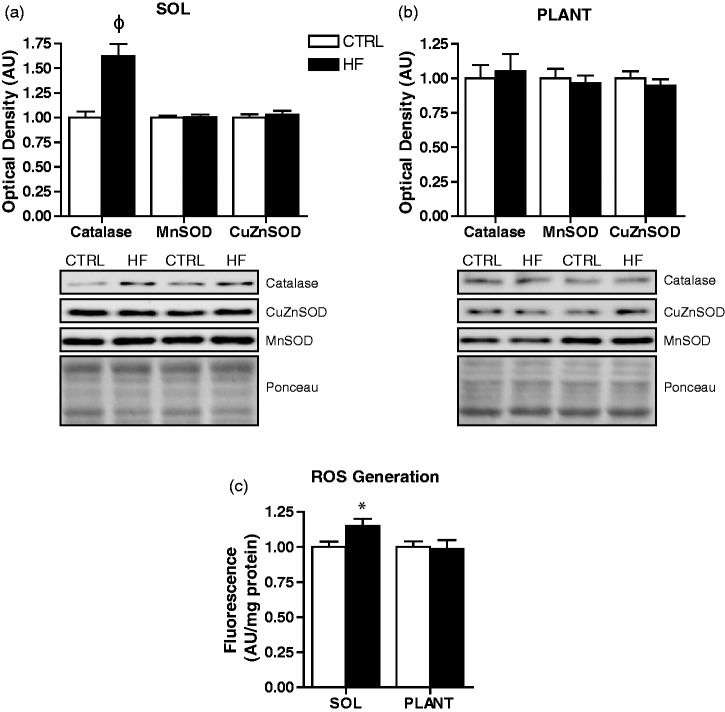
Figure 9.
Antioxidant enzyme protein content and ROS generation. Quantitative analysis and representative immunoblots of catalase, MnSOD, and CuZnSOD in soleus (a) and plantaris (b). Also shown are corresponding Ponceau-stained membranes. Quantitative analysis of reactive oxygen species (ROS) generation in soleus and plantaris (c). *P < 0.05 vs. CTRL. φP < 0.001 vs. CTRL

