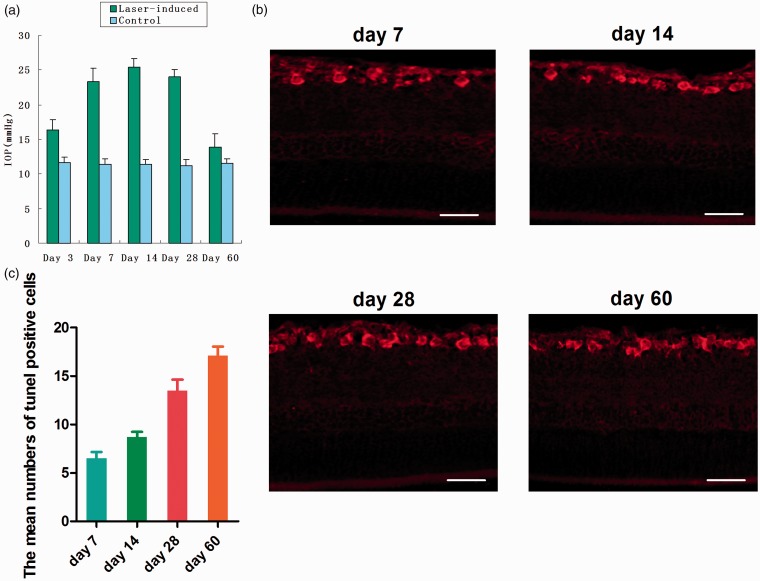
Figure 2.
Apoptosis of retinal ganglion cells in rat chronic ocular hypertension glaucoma model. Ocular hypertension was induced using laser photocoagulation. The mean IOP of glaucomatous eyes was elevated significantly compared with those of contralateral eyes from day 3 to day 28. IOP was gradually increased with the time and reached the maximum in 7–14 days. IOP began to decline about day 28 and returned to normal level about two months later (a). TUNEL staining of retinal ganglion cells in rat chronic ocular hypertension glaucoma model. At day 60, IOP was decreased to the normal level, but the number of apoptotic cells was still increasing (b, c). Bar = 100 µm. (A color version of this figure is available in the online journal.)

