Figure 5.
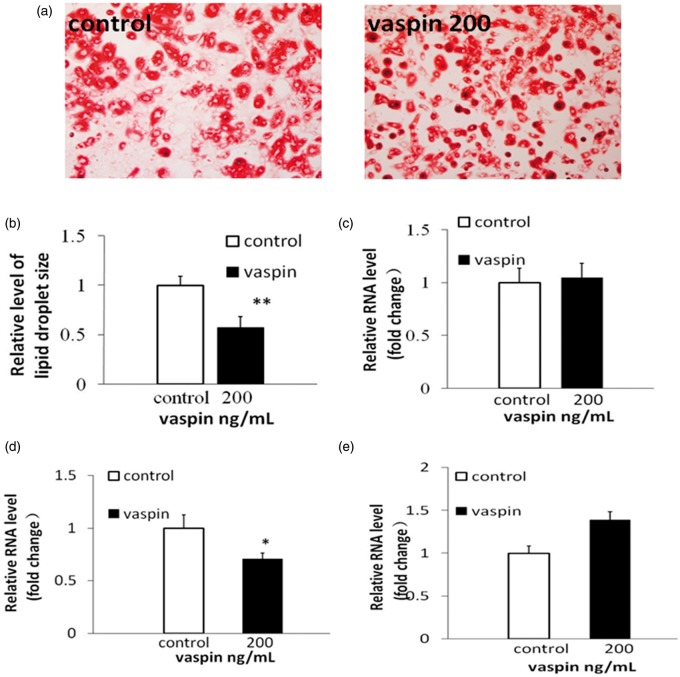
3T3-L1 preadipocytes were treated with 200 ng/mL vaspin during differentiation. On day 8 of differentiation, (a) the cells were stained with Oil Red O. (b) The sizes of the lipid droplets were analyzed using Image Pro Plus 6.0. (c, d, and e) The mRNA levels of adiponectin, IL-6 and GLUT4 were analyzed using RT-PCR analysis. *P < 0.05 compared with the control group; **P < 0.01 compared with the control group. (A color version of this figure is available in the online journal.)

