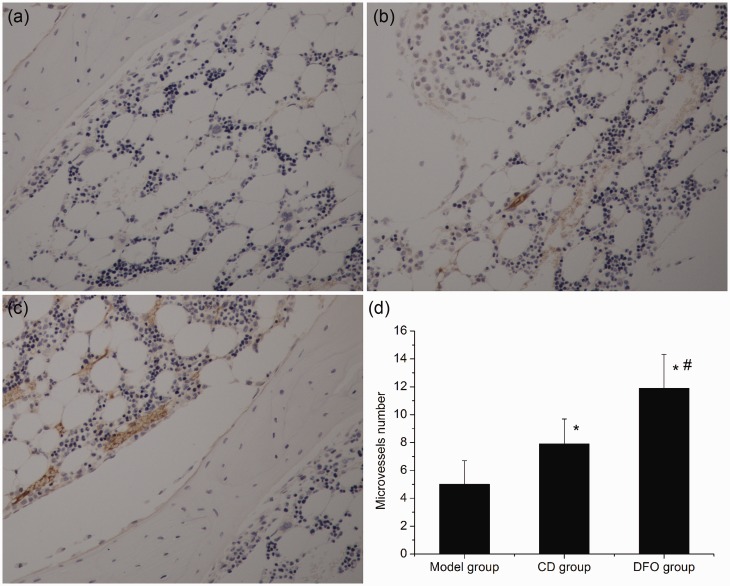
Figure 3.
Immuohistochemical staining for vWF (200 × magnification) and microvessel analysis. (a) Representative photomicrograph of the model group showed that there were few microvessels in the femoral head. (b) In the CD group, increased microvessels were observed. (c) In the DFO group, significantly higher numbers of microvessels were present. (d) Bar graph shows the number of microvessels in each group. *P < 0.05 versus model group; #P < 0.05 versus CD group; n = 10. (A color version of this figure is available in the online journal.)

