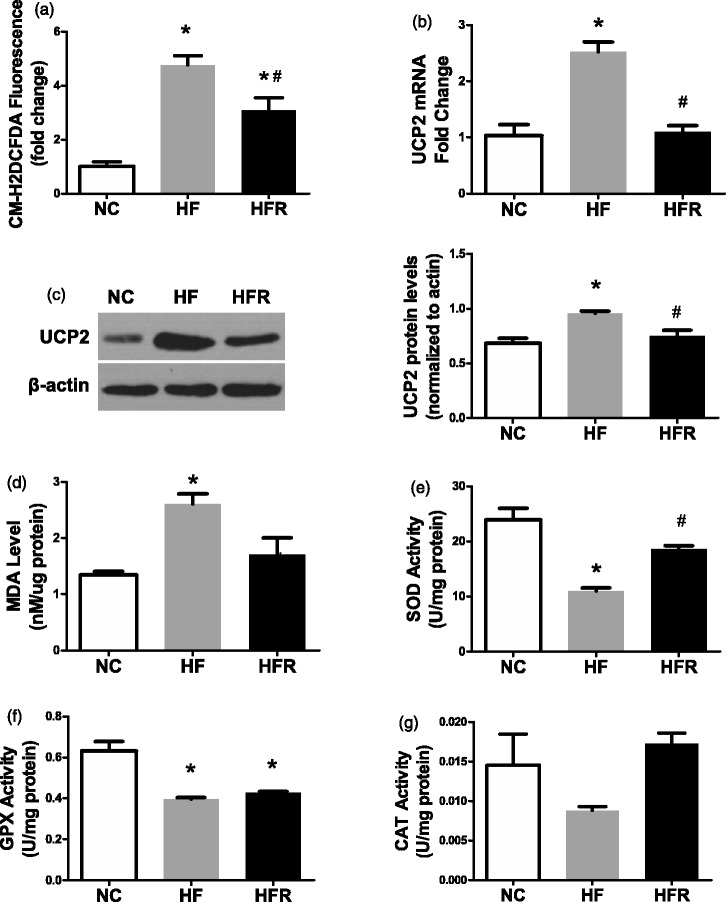
Figure 6.
Assesses oxidative stress level in islet. NC: Rats that were fed the normal chow diet ad libitum for all 8 weeks. HF: Rats that were fed the high-fat diet ad libitum and received vehicle (control) for 8 weeks. HFR: Rats that were fed the high-fat diet ad libitum and received resveratrol (100 mg/kg body weight daily) orally for 8 weeks. (a) Mitochondrial ROS production was quantified by CM-H2DCFDA fluorescence. (b) UCP2 mRNA level was expressed as another marker of oxidative stress damage. (c) UCP2 protein level was expressed as another marker of oxidative stress damage. (d) Islet damage caused by oxidative stress was expressed by MDA level in fresh isolated islet. (e) SOD activity level in isolated islet. (f) GPX activity level in isolated islet. (g) CAT activity level in isolated islet. The data shown are the means ± SE. n = 4 in each group. *P < 0.05 versus NC, #P < 0.05 versus HF

