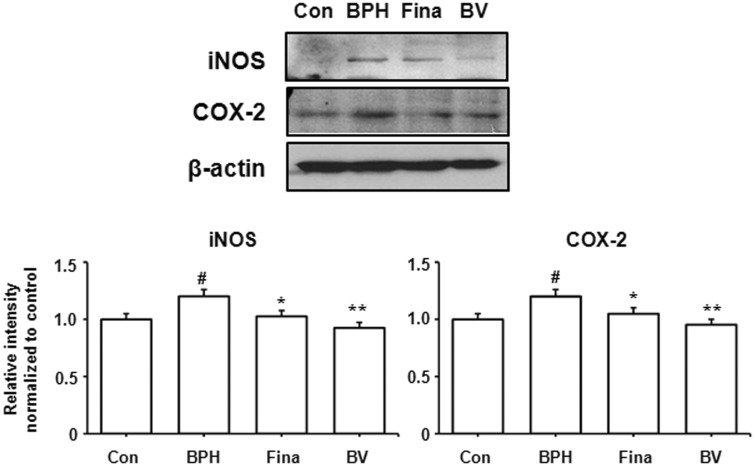
Figure 4.
Effect of BV administration on the expression of iNOS and COX-2 in prostate tissues of BPH-induced rat models. The expression levels of iNOS proteins and COX-2 proteins were determined by western blotting using specific antibodies. β-actin was used as internal controls. Densitometric analysis was performed using Bio-rad Quantity One® Software. Con (control group); BPH (BPH-induced group); Fina (BPH-induced group treated with finasteride 5 mg/kg/day; p.o.); BV (BPH-induced group treated with BV 0.1 mg/kg/day; i.p.). The data shown represent mean ± SEM of six rats per group. #p < 0.05 vs. Con group; *p < 0.05, **p < 0.01 vs. BPH group

