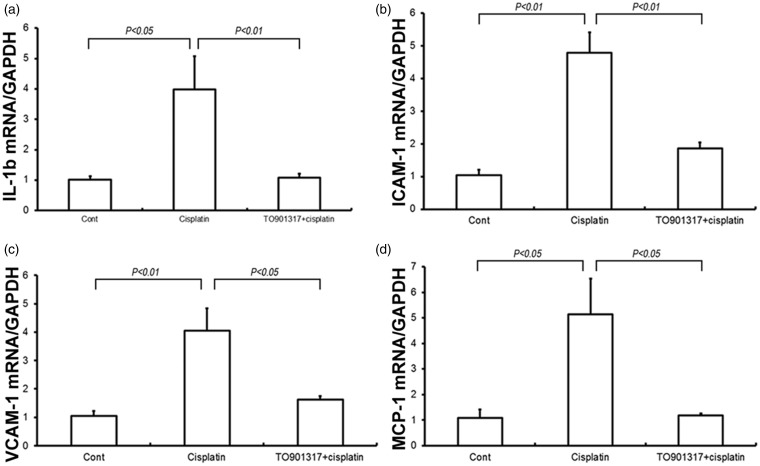
Figure 5.
Levels of pro-inflammatory cytokines and adhesion molecules in control, Cisplatin vehicle, and Cisplatin + TO901317 mice. (a) Real-time RT-PCR of renal IL-1βexpression; (b) Real-time RT-PCR of renal ICAM-1 expression; (c) Real-time RT-PCR of renal VCAM-1 expression; (d) Real-time RT-PCR of renal MCP-1 expression. The expression was normalized to GAPDH levels. Cont: n = 8; Cisplatin: n = 12; Cisplatin + TO901317: n = 14. Data are mean ± SEM

