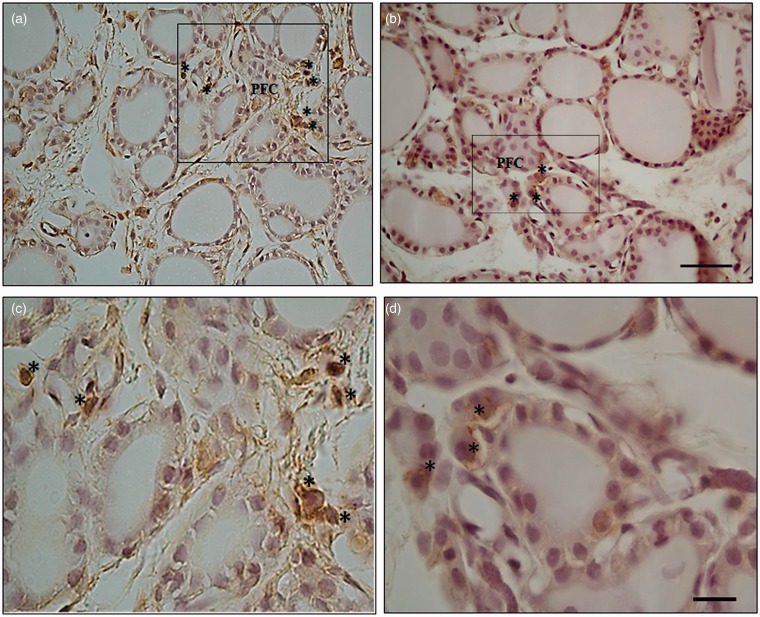
Figure 7.
Photographs of rat thyroid tissue with HSP-90 inmunohistochemistry show differences in expression in parafollicular cells in animals euthanized 90 min after exposure to 3 and 12 W at 40× magnification (photos a and c) and at 100× magnification (photos b and d). Asterisks * indicate parafollicular cells (PFC). Calibration bars (a, c) = 40 µm; (b, d) = 20 µm. (A color version of this figure is available in the online journal.)

