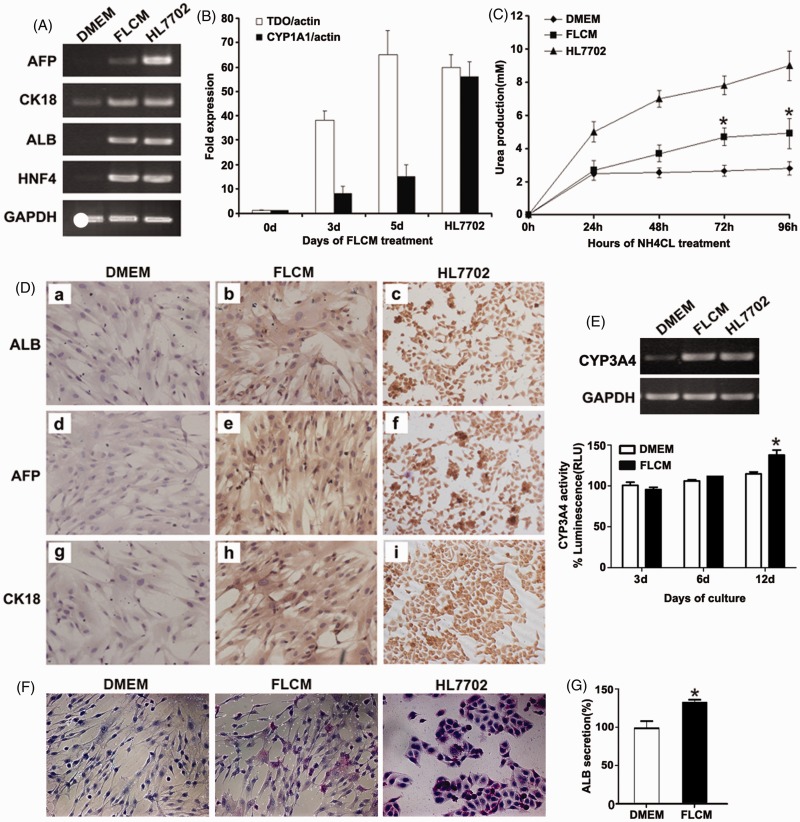
Figure 2.
FLCM-induced hepatic differentiation of hUCMSCs. A: Expression of hepatic-specific genes evaluated by RT-PCR at day 3 post-FLCM induction; B: Expression of hepatic-specific genes evaluated by real-time PCR. The level of TDO and CYP1A1 expression is shown as a fold-change compared with 0 day. Human hepatocyte cell line HL7702 was used as a positive control. Data are expressed as mean + SD of three experiments; C: Urea production in the medium of induced hUCMSCs at different time. Data are expressed as mean + SD of six experiments. *P < 0.05, compared with DMEM-treated hUCMSCs. D: Immunocytochemistry analysis of hepatic-specific genes ALB, AFP, CK-18 expression in DMEM (a, d, g) and FLCM (b, e, h) treated hUCMSCs on day 3. Human hepatocyte cell line HL7702 was used as a positive control (c, f, i). (magnification, ×200). E: Expression of CYP3A4 gene at 12 days and CYP3A4 activity at 3, 6, and 12 days during FLCM culture. F: Periodic Acid-Schiff staining of FLCM-treated hUCMSCs on day 12. DMEM-cultured hUCMSCs and HL7702 were used as control. G: ALB secretion in the medium of induced hUCMSCs at day 12. Data are expressed as mean + SD of three experiments. *P < 0.05, compared with DMEM-treated hUCMSCs. FLCM, fetal liver conditioned medium. TDO, tryptophan 2,3-dioxygenase. AFP, a-fetoprotein; ALB, albumin; CK-18, Cytokeratin 18; HNF4, human nuclear factor 4; CYP1A1, cytochrome P450 1A1; CYP3A4, cytochrome P450 3A4. (A color version of this figure is available in the online journal.)

