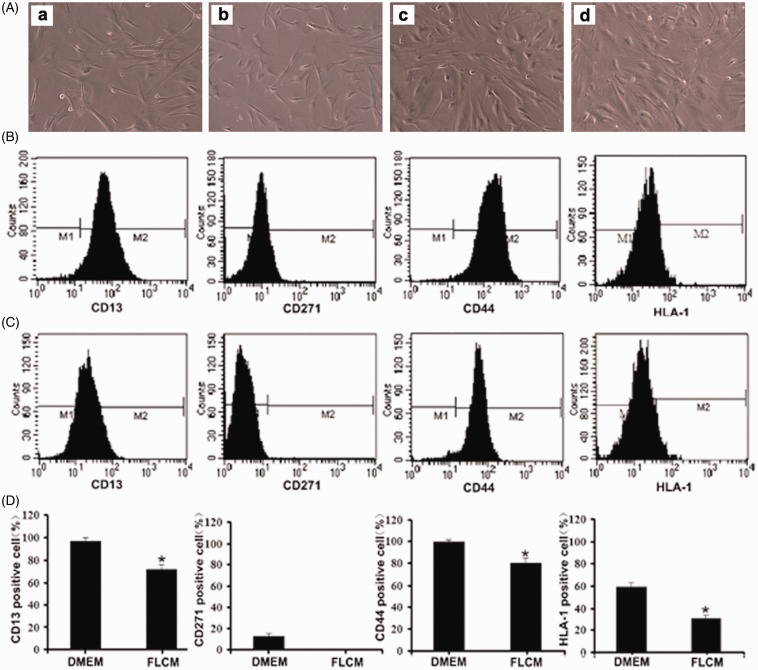
Figure 3.
MSC-specific markers in FLCM-treated hUCMSCs. A: The morphology of hUCMSCs at 0 (a), 3 (b), 7 (c), 14 (d) days during FLCM treatment; B and C: Expression of MSC-specific surface markers in hUCMSCs before (B) and after (C) FLCM treatment; D: The percentage of hUCMSCs positive for CD13, CD271, CD44, and HLA-I were 96.32, 13.8, 99.05, and 60.58%, respectively. On day 3 after FLCM treatment, cells expressing MSC-specific markers decreased to 71.43, 0.03, 81.2, and 31.13%, respectively. FLCM, fetal liver conditioned medium.*P < 0.05, compared with DMEM group. (A color version of this figure is available in the online journal.)

