Figure 4.
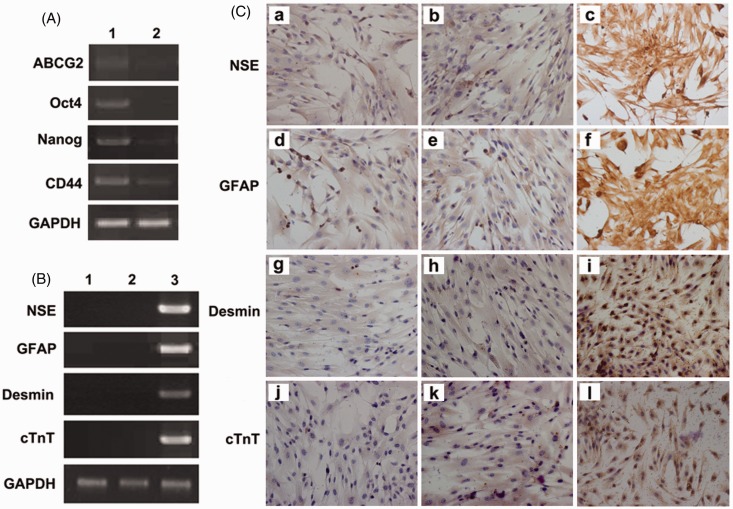
Analysis of FLCM-induced hepatic specificity. A: Expression of MSC-specific genes ABCG2, OCT4, Nanog, CD44 by RT-PCR in DMEM and FLCM-induced hUCMSCs. (Lane 1, DMEM; Lane 2, FLCM); B: Expression of nerve cell-specific genes NSE, GFAP and cardiocyte-specific genes desmin, cTnT by RT-PCR in DMEM and FLCM-induced hUCMSCs. (Lane 1, DMEM; Lane 2, FLCM; 3, Positive control of primary nerve cell for NSE, GFAP and human cardiomyocyte for desmin, cTnT). C: Immunocytochemistry analysis of cardiocyte- and nerve cell-specific proteins in DMEM and FLCM-cultured hUCMSCs. hUCMSCs cultured in DMEM (a, d, g, j) and FLCM (b, e, h, k) were negatively stained for NSE, GFAP, desmin, and cTnT. Primary nerve cell and human cardiomyocyte served as a positive control (c, f, i, l). (magnification × 200). cTnT, cardiac troponin T; NSE, neuron-specific enolase; ABCG2, ATP-binding cassette sub-family G member 2; GFAP, glial fibrillary acidic protein. (A color version of this figure is available in the online journal.)

