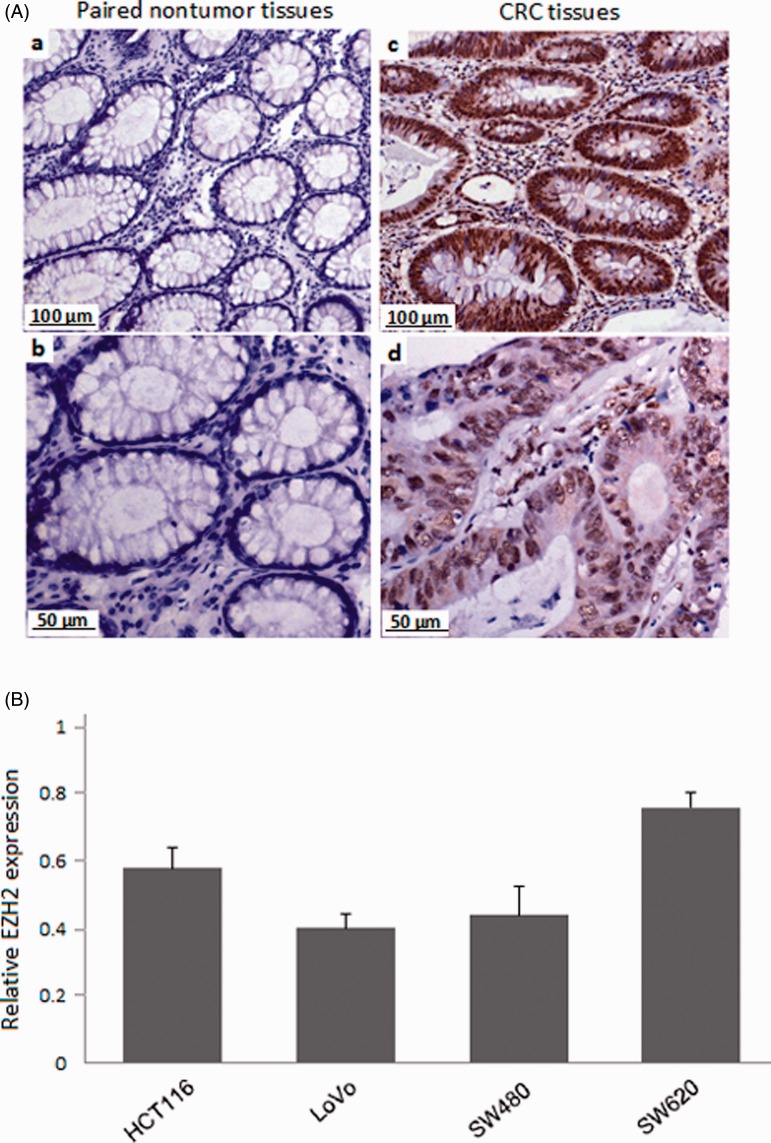
Figure 1.
EZH2 Expression in CRC tissues and cell lines. A: Expression of EZH2 in tumor tissues and the paired non-tumor tissues was detected by IHC. Negative expression of EZH2 in the paired non-tumor tissues (a and b); EZH2 was up-regulated expressed in tumor tissues (c and d). Original magnification × 200 (a and c), × 400 (b and d). B: Relative expression of EZH2 mRNA in four CRC cell lines (HCT116, LoVo, SW480, and SW620) detected by RT-PCR. Results are given as average value of the gray in three target genes and internal controls from three independent experiments. (A color version of this figure is available in the online journal.)

