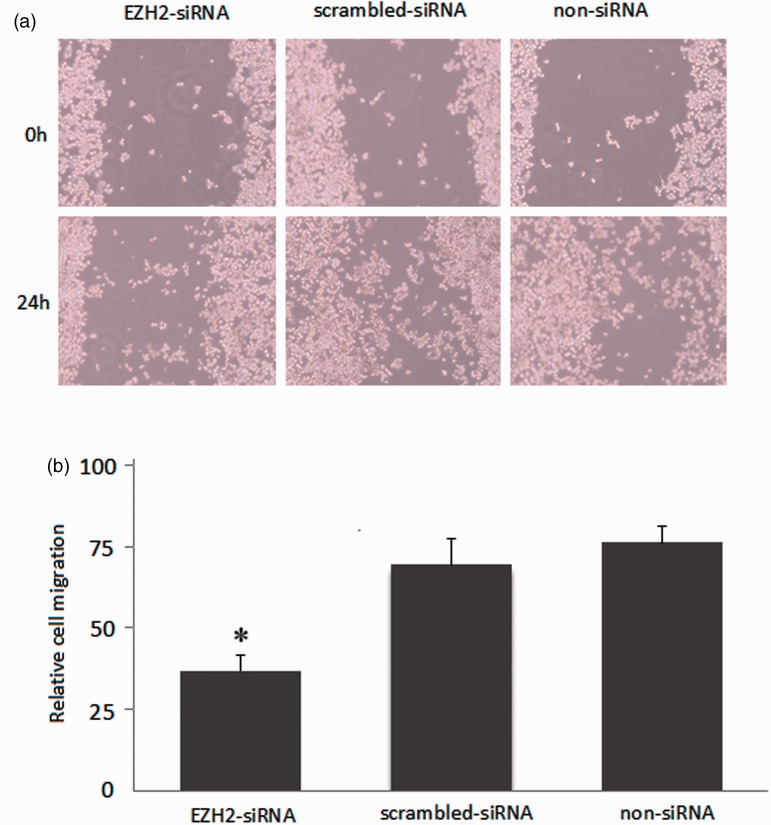
Figure 5.
Influence of migration in SW620 cells after EZH2-siRNA transfection. (a) The SW620 cells were subjected to the migration assay 24 h after transfection of EZH2-siRNA. (b) The histograms represent the quantification of cells having wounding remaining width. *, compared with scrambled-siRNA group and non-siRNA group, P < 0.05. The results shown were representative of three independent experiments. (A color version of this figure is available in the online journal)

