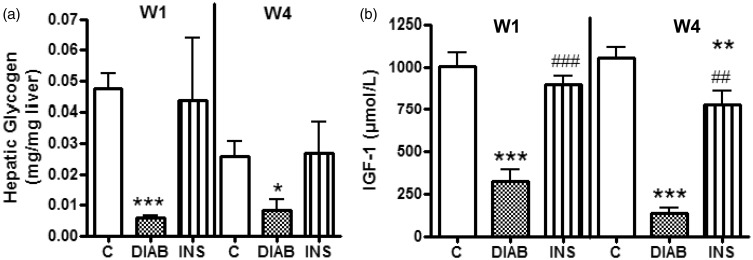
Figure 2.
Measurement of hepatic glycogen content (a) and plasma IGF-1 levels (b). Results are given as mean ± SEM for control rats (C), non-treated diabetic rats (DIAB), and insulin-treated rats (INS) after one week (W1) and four weeks (W4), n = 5; mean ± SEM *p > 0.05, **p < 0.01, ***p < 0.001 compared with C-rats, ##p < 0.01, ###p < 0.001 compared with DIAB rats

