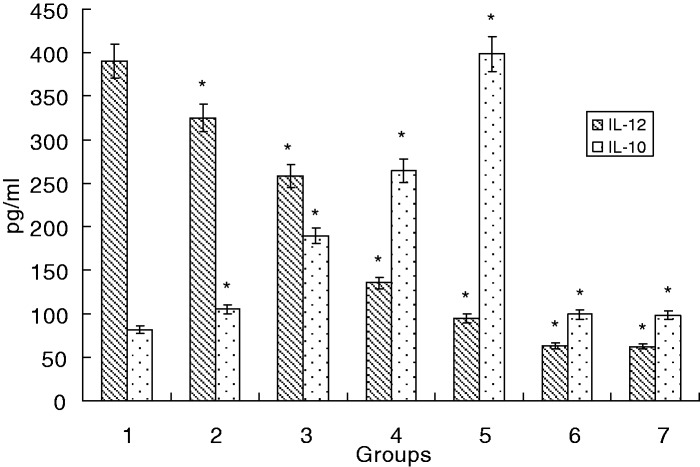
Figure 4.
Cytokine levels in Mo-DC culture supernatants. Immature Mo-DCs were differentiated from monocytes with GM-CSF and IL-4. Mo-DCs were then stimulated with LPS in the presence or absence of C12 for five days. The cytokine concentrations in the supernatants of the C12 groups and control groups were determined by ELISA and expressed as pg/mL. The illustrated data represent the mean ± SD of the results from three separate experiments; *P < 0.05 compared with the LPS group. (Note: 1: LPS group; 2: 3-O-C12-HSL group with a final concentration of 5 µmol/L with 1 µg/mL of LPS; 3: 3-O-C12-HSL group with a final concentration of 10 µmol/L with 1 µg/mL of LPS; 4: 3-O-C12-HSL group with a final concentration of 25 µmol/L with 1 µg/mL of LPS; 5: 3-O-C12-HSL group with a final concentration of 50 µmol/L with 1 µg/mL of LPS; 6: 3-O-C12-HSL group with a final concentration of 100 µmol/L with 1 µg/mL of LPS; 7: PBS group.)

