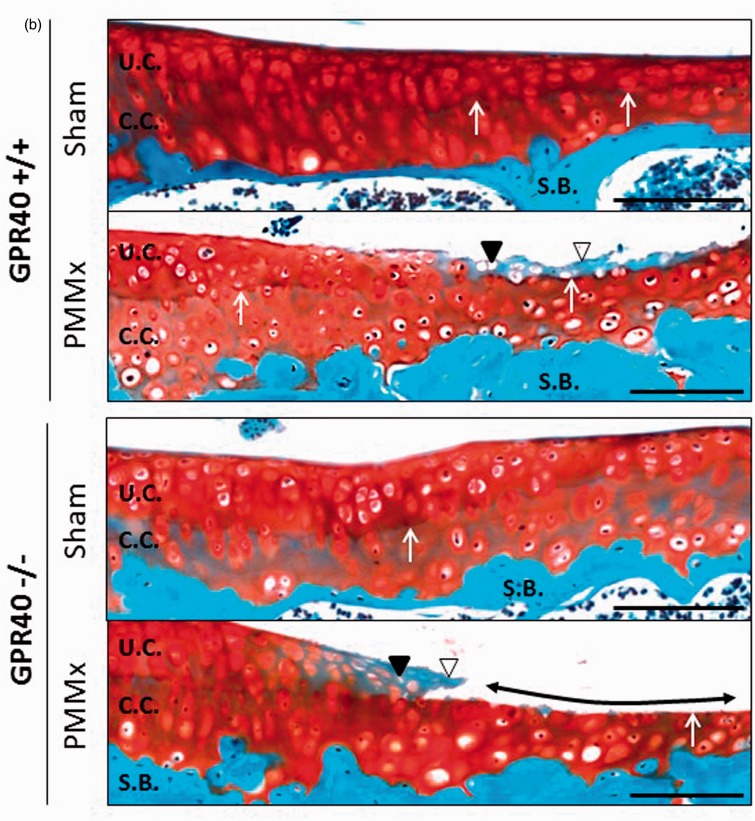
Figure 2.
GPR40 deficiency results in an enhanced joint injury in surgical-induced OA knees. (a) Representative histological cross-sections of GPR40+/+ and GPR40−/− joint knees, eight weeks after surgical OA induction (PMMx) or not (sham-operated), stained with Safranin O/fast green. Black arrow heads show area of cartilage degradation and tidemark exposure; asterisks localize subchondral bone (S.B.) sclerosis; dotted lines delimit osteophytes at the merge of tibia. Bars represent 1 mm (magnification x5). (b) Representative focused images from articular cartilage of the medial tibial plateau. White arrow heads indicate loss of safranin O staining; black arrow heads show empty chondroplast due to chondrocyte apoptosis, white arrows localize the tidemark (between uncalcified [UC] and calcified cartilage [CC]); double head arrows demonstrate tidemark exposures. Bars represent 500 µm (magnification x10). (c) OARSI grade. Bars represent means of the summed scores for all quadrants of each group ± SEM (n = 5). (d and e) Quantification of the uncalcified/total cartilage area ratio and of the Tidemark exposure, respectively, both reflecting cartilage breakdown on the medial tibia plateau. Results are presented as means ± SEM (n = 5). (f) Bone volume fraction (bone area/tissue area) measured in the subchondral bone (medial tibia). (g) Representative images focused on the median tibial edge. Bars represent 500 µm (magnification x10). Dotted lines circle osteophyte area. (h) Frequency of osteophyte formation in PMMx groups and mean area of osteophyte per group (µm2) ± SEM. (*), (#), and (§) indicate significant differences compared to IL-1β untreated group, IL-1β treated GPR40+/+ group and to IL-1β untreated GPR40+/+ group, respectively. (A color version of this figure is available in the online journal.)


