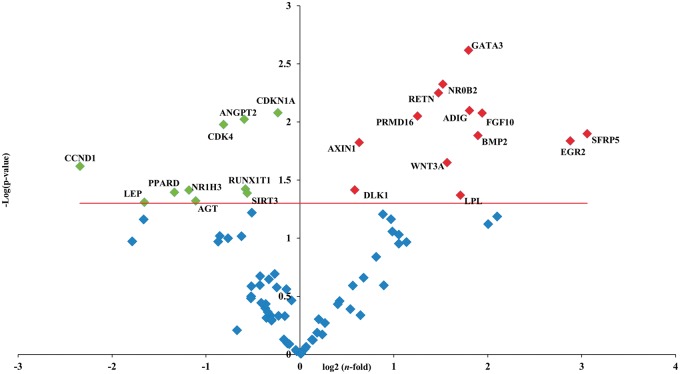
Figure 4.
Volcano plot of adipogenesis PCR array. PCR array analysis of gene expression in RO-treated P20 cells in comparison to P20 CTRL cells. Total RNA was isolated from three independent experiments, one per each donor, were prepared for both CTRL and RO extract incubation. Cells were used at the third passage. The relative expression levels for each gene depicted as log2(n-fold) are plotted against -Log(p-value). Red indicator = significantly up-regulated gene; Green indicator = significantly down-regulated gene. Red line = indicates −Log(p value), P < 0.05. (A color version of this figure is available in the online journal.)

