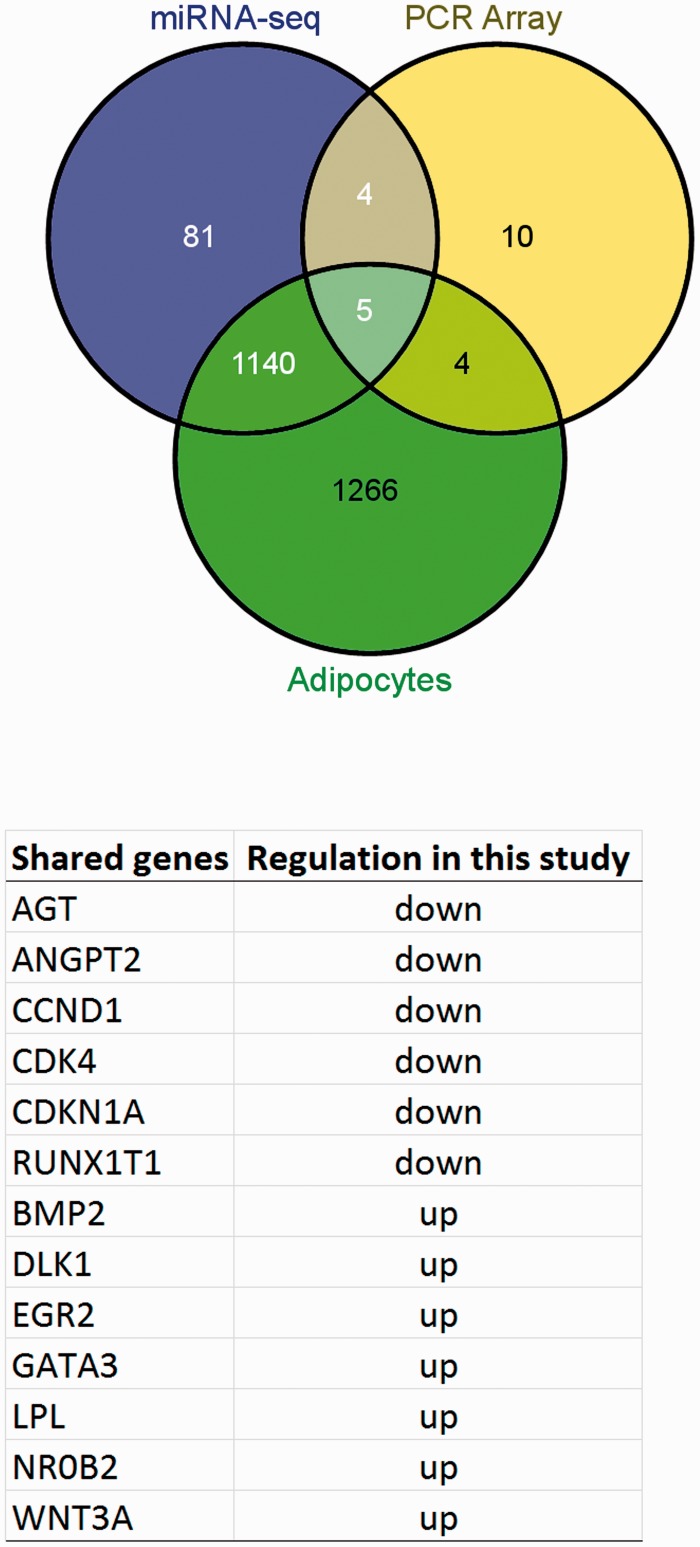
Figure 5.
Venn diagram showing relation between validated genes target (1230 genes) of miRNA-seq significantly up- and down- regulated (miRNA-seq), validated genes of miRNAs-adipocyte (Adipocytes) (2415 genes) and significantly differentially expressed genes (23 genes) obtained by PCR array (PCR Array). Table shows the list of 13 shared genes and their regulation (as shown in Volcano plot) (A color version of this figure is available in the online journal.)

