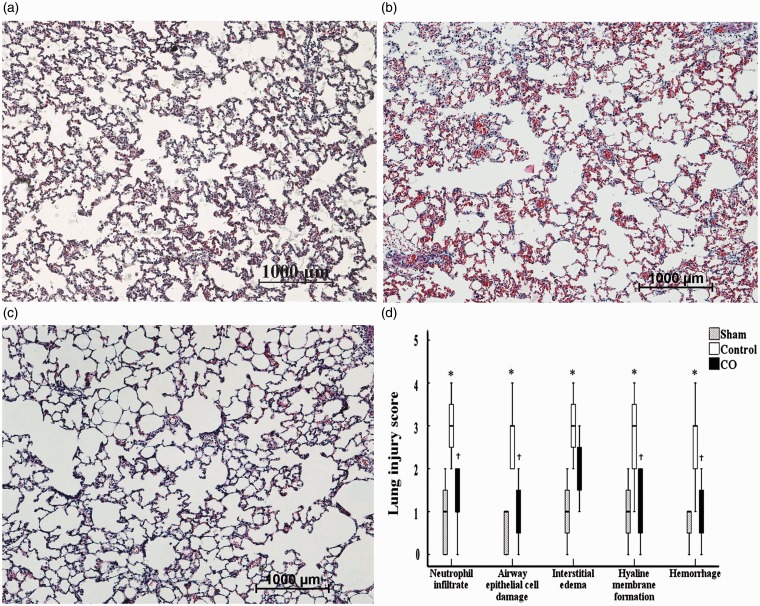
Figure 2.
Histological analyses of the lung tissues. Paraformaldehyde-fixed sections of the lung grafts were stained with hematoxylin and eosin. a: sham group; b: control group; c: CO group; d: lung injury score (LIS) of every criterion applied to the lung tissues. The figure represents × 10 the original magnification. Lung tissues in the sham group had nearly normal tissue, and the LIS for every criterion were ameliorated in the CO group compared with the control group. *P < 0.05 vs. sham group; †P < 0.05 vs. control group. (A color version of this figure is available in the online journal.)

