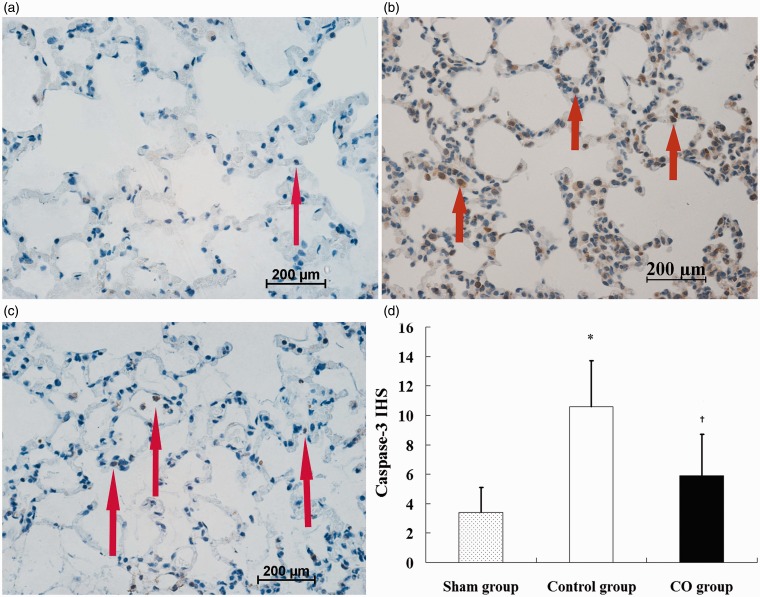
Figure 4.
Expression of caspase-3 protein in lung tissues. a: sham group; b: control group; c: CO group; d: immunohistochemical scores (IHS) of caspase-3 protein in lung tissues. Figures represent × 40 the original magnification. Data represent five rats. Positive cells are represented by brown granules in the cytoplasm (arrows). *P < 0.05 vs. sham group; †P < 0.05 vs. control group. (A color version of this figure is available in the online journal.)

