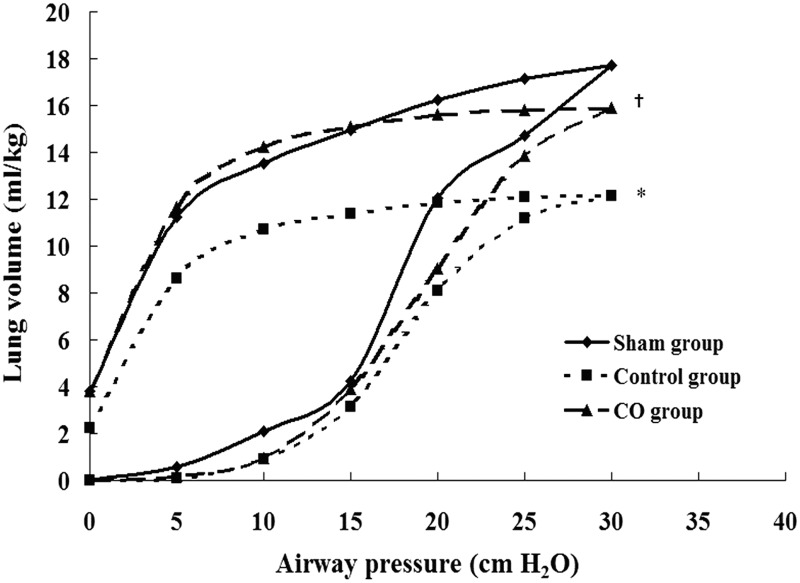
Figure 5.
Static pressure–volume (P–V) curves of lung tissues. Values are means: standard deviation bars were omitted for clarity. Data represent four rats. The values of the P–V curves of the control group were lower than those of the sham group, and the values of the P–V curves of the CO group were significantly improved compared with those of the control group. *P < 0.05 vs. sham group; †P < 0.05 vs. control group

